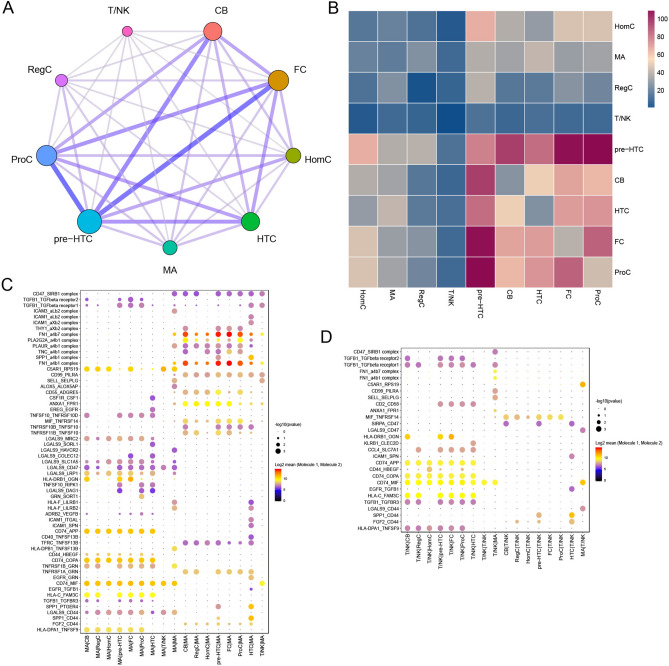
Fig. 6.
Complex intercellular interaction network in degenerative endplate cells. (A) Interaction network constructed by CellPhoneDB analysis. Thicker lines indicate more interaction with other types of cells. (B) Heatmap showing the number of potential ligand-receptor pairs among the predicted cell types. (C) The detected ligand-receptor pairs of MAs and all chondrocyte subsets by CellPhoneDB. (D) The detected ligand-receptor pairs of T/NK cells and all chondrocyte subsets by CellPhoneDB. CB, chondroblasts; RegC, regulatory chondrocytes; HomC, homeostatic chondrocytes; pre-HTC, prehypertrophic chondrocytes; FC, fibrocartilage chondrocytes; ProC, proliferative chondrocytes; HTC, hypertrophic chondrocytes; MA, macrophages; T/NK, T cells/natural killer cells.

