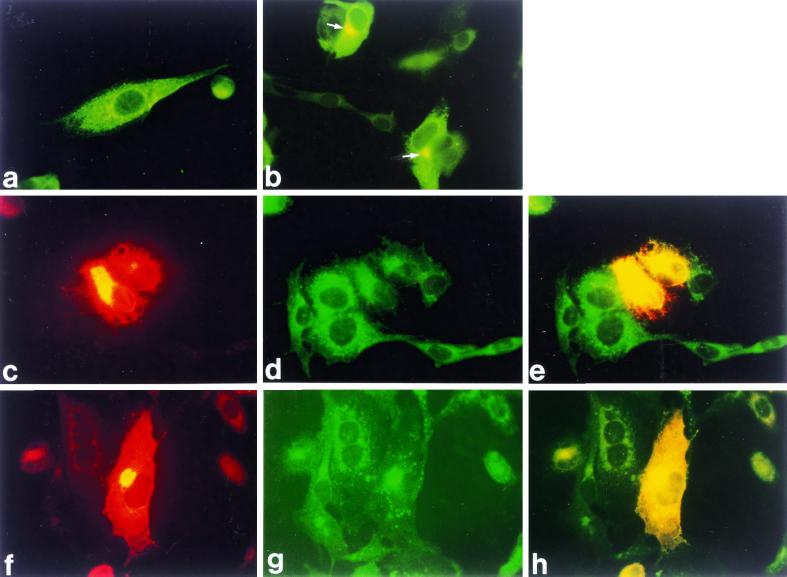
FIG. 4.
Immunofluorescence analysis of G2 expression from transcripts from pSFV-G2. (a) At 6 h.p.t. with anti-G2. (b) At 21 h.p.t. with anti-G2; arrows indicate perinuclear signal. (c) At 6 h.p.t. with anti-G2. (d) Same cells treated with ER marker DiOC6. (e) Merge (double exposure) of c and d. (f) At 21 h.p.t. with anti-G2. (g) Same cells treated with Golgi marker WGA-FITC. (h) Merge of f and g. Yellow areas in c and f indicate overexposure of the film as explained in the legend to Fig. 3.

