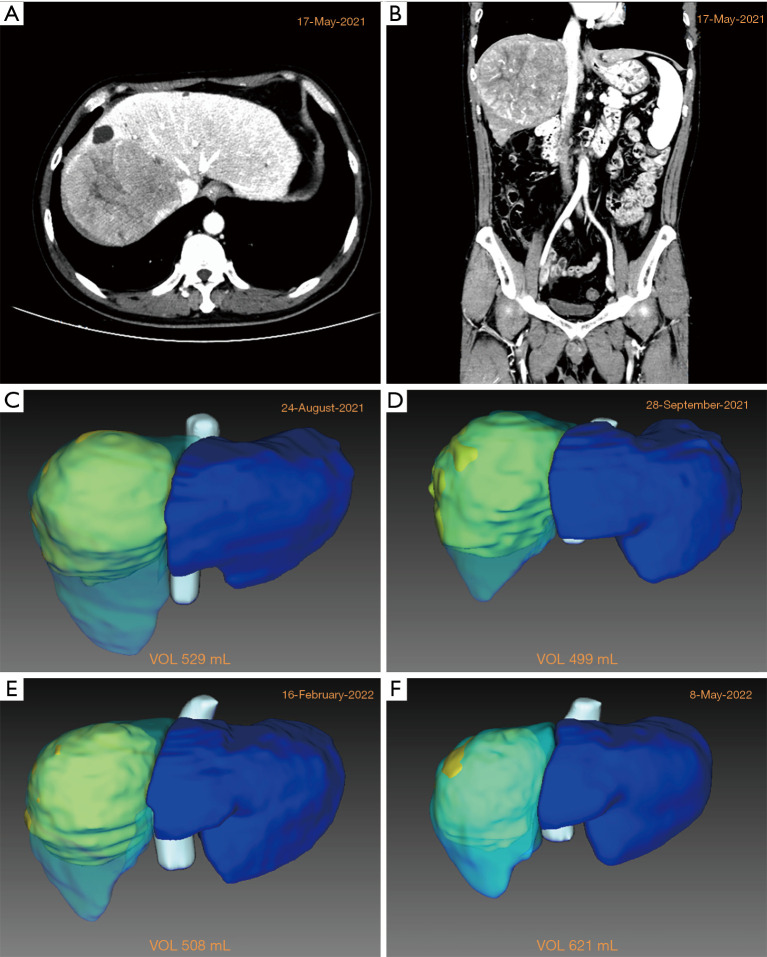
Figure 1.
Changes in the patient’s liver volume over the course of treatment. (A,B) Contrast-enhanced abdominal computed tomography showing a hypodense mass in the right lobe of the liver with a diameter of 14 cm, and invasion of the middle hepatic vein and inferior vena cava. (C-F) Changes in the volume of the left lobe of the liver during treatment. VOL, volume of the left liver.

