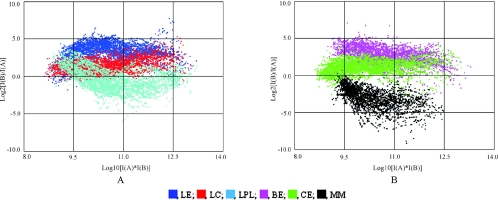
FIG. 3.
Raw intensity (RI) graph of overall gene expression profiles from microarray analysis of locust-related extracts (A) and the others (B). I(A) and I(B) represent the intensity data from channel A (Cy3) and channel B (Cy5), respectively. LE, locust dichloromethane extracts; LC, locust cuticle; LPL, locust polar lipid; BE, beetle extract; CE, cicada extracts; MM, minimal medium.

