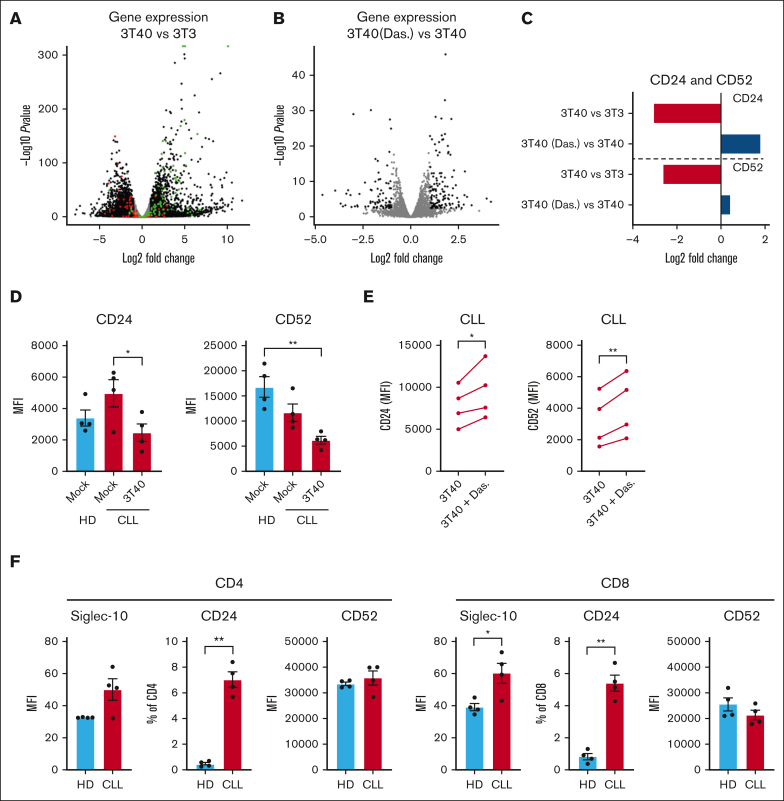
Figure 5.
RNA sequencing reveals expression of CD24 and CD52 as drivers of T-cell dysfunction. PBMCs from 4 patients with CLL were thawed and cultured on a layer of CD40L expressing fibroblasts for 2 days with or without 1 μM dasatinib. (A) Volcano plot depicting gene expression changes between CLL cells cultured on 3T40 vs those cultured on 3T3 (control). The black dots depict genes that were significantly differentially expressed (false discovery rate [FDR] <0.05; fold change >2), green dots represent known genes induced by CD40 signaling, and red dots are known genes that are down regulated after CD40 signaling (retrieved from Molecular Signatures Database; MSigDB [down = M1899 and up = M8493, CLL, n = 3-4]). (B) Volcano plot depicting gene expression changes between CLL cells cultured on 3T40 in the presence or absence of dasatinib. In black are genes that were significantly differentially expressed (FDR <0.05; fold change >2; CLL, n = 3-4). (C) Bar graph depicting the fold change of CD24 and CD52 transcription in CD40 stimulated CLL cells treated with or without dasatinib. (D) PBMCs from HDs or patients with CLL were cultured on a layer of mock or CD40L expressing fibroblasts for 2 days, and CD52 and CD24 expression was measured (HD, n = 4; CLL, n = 4). (E) PBMCs from patients with CLL were cultured on a layer of CD40L-expressing fibroblasts for 2 days with or without dasatinib, and CD24 and CD52 expression was measured (CLL, n = 4). (F) Expression of Siglec-10, CD24, and CD52 was measured on freshly thawed T cells from HD and patients with CLL ex vivo (HD, n = 4; CLL, n = 4). P values were calculated using a 1-way ANOVA (D) or a paired t test (E) or a Welch t test (F). Data are presented as mean ± SEM; ∗P ≤ .05, ∗∗P ≤ .01, ∗∗∗P ≤ .001, ∗∗∗∗P ≤ .0001. MFI, mean fluorescence intensity.

