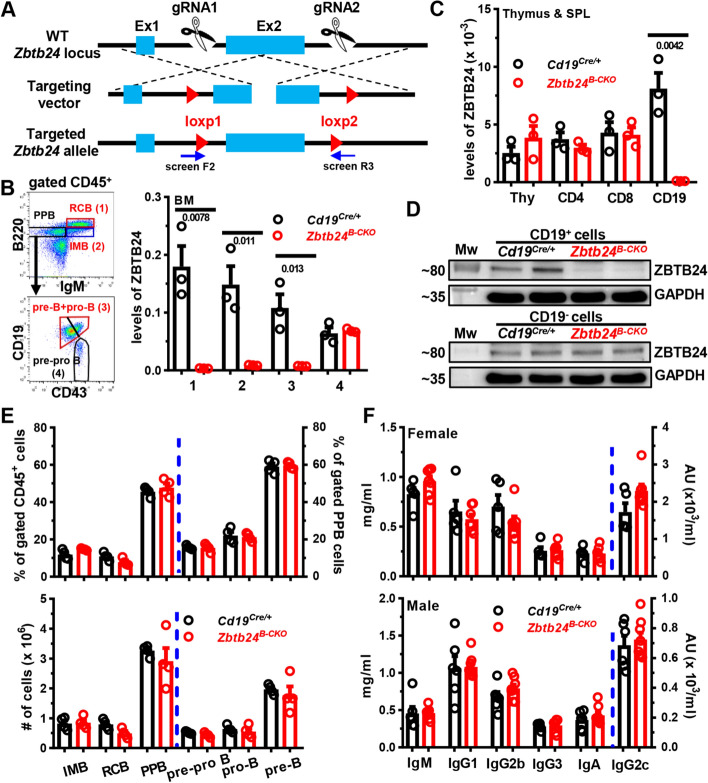
Fig. 1.
No effect of B cell specific depletion of Zbtb24 on B cell development in the bone marrow (BM) and baseline serum antibody levels in mice. A A schematic representation for generating Zbtb24loxp/+ mice using the CRISPER/CAS9 strategy. Screen F2 and R3 denote primers used to select correctly-targeted ES clones. B–D Efficient and specific deletions of ZBTB24 in CD19+ B cells in Cd19Cre/+Zbtb24loxp/loxp (Zbtb24B−CKO) mice. Levels of ZBTB24 were analyzed in FACS-sorted B220++IgM+ recirculating mature B cells (RCB, gate 1), B220+IgM+ immature B cells (IMB, gate 2), B220+IgM−CD19+CD43− pre-B plus B220+IgM−CD19+CD43+ pro-B cells (gate 3), and B220+IgM−CD19−CD43+ pre-pro B cells (gate 4) in the BM (B), or FACS-purified CD4+ (CD4), CD8+ (CD8) T cells and CD19+ (CD19) B cells in spleens (SPL) as well as total thymocytes (Thy) (C) of control Cd19Cre/+ versus Zbtb24B−CKO mice by quantitative PCR. Sorting strategies for indicated BM B cell subsets were shown in the left of B. Expressions of ZBTB24 were normalized to internal glyceraldehyde 3-phosphate dehydrogenase (GAPDH) (B, C). Protein levels of ZBTB24 were analyzed in beads-purified splenic CD19+ B cells (upper) and the remaining CD19− fraction (lower) by Western blot (D). E Bar graphs showing the percents (upper panel) or absolute numbers (lower) of indicated B cell subsets in the BM of control Cd19Cre/+ and Zbtb24B−CKO mice. F Bar graphs showing levels of total immunoglobulin M (IgM), IgG1, IgG2b, IgG2c, IgG3, and IgA in sera of female (8–10 weeks old) and male (9–11 weeks old) Cd19Cre/+ versus Zbtb24B−CKO mice. Each symbol/lane represents a single mouse of the indicated genotype, and numbers below horizontal lines indicate P values determined by student t-test (B, C). Data in E, F are representative of two independent experiments. PPB, pre-pro/pro/pre B cells; Mw, molecular weight marker; AU, arbitrary units

