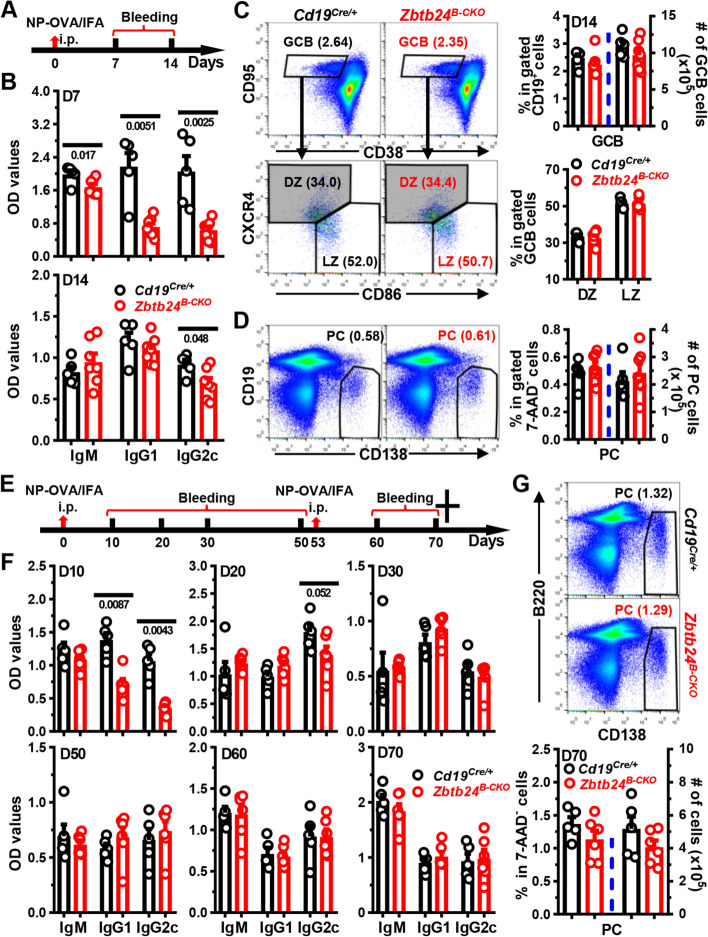
Fig. 2.
No significant defects in antibody responses in Zbtb24B−CKO mice post primary/secondary NP-OVA/IFA immunization. Mice (10-week old males in A-D; and 8-week old females in E–G) were intraperitoneally (i.p.) immunized with NP19-OVA emulsified in IFA (1:1, 50 μg/100 μl/mouse) on D0, followed by i.p. rechallenging with NP19-OVA/IFA (3:1, 20 μg/100 μl/mouse) on D53 (only in E–G). Sera were collected on indicated days and NP-specific antibodies were detected by ELISA. Cells in spleens on day (D) 14 (C, D) or D70 (G) were stained with antibodies, in combination with 7-AAD to exclude dead cells, to visualize the percents of CD19+CD38lowCD95high germinal center B (GCB) cells or CD19−/lowCD138high plasma cells (PC) by flow cytometry. A, E, schematic diagrams illustrating the immunization and bleeding schedules of mice. B, F, bar graphs showing the optical density (OD) values of NP-specific antibodies in sera of Cd19Cre/+ and Zbtb24B−CKO mice on indicated days. C representative pseudo-plots showing the percentages of GCB (within gated 7-AAD−CD19+ B cells) and frequencies of dark zone centroblasts (DZ, CXCR4highCD86low) and light zone centrocytes (LZ, CXCR4lowCD86high) within gated GCB cells in control Cd19Cre/+ and Zbtb24B−CKO mice. D, G Representative pseudo-plots showing the percentages of PCs in spleens of mice on D14 (D) or D70 (G). Cumulative data on the percentages or absolute numbers of indicated B cell subsets were shown in the right of C, D or bottom of G. Each symbol represents a single mouse of the indicated genotype, and numbers below horizontal lines indicate P values while those in brackets denote percentages

