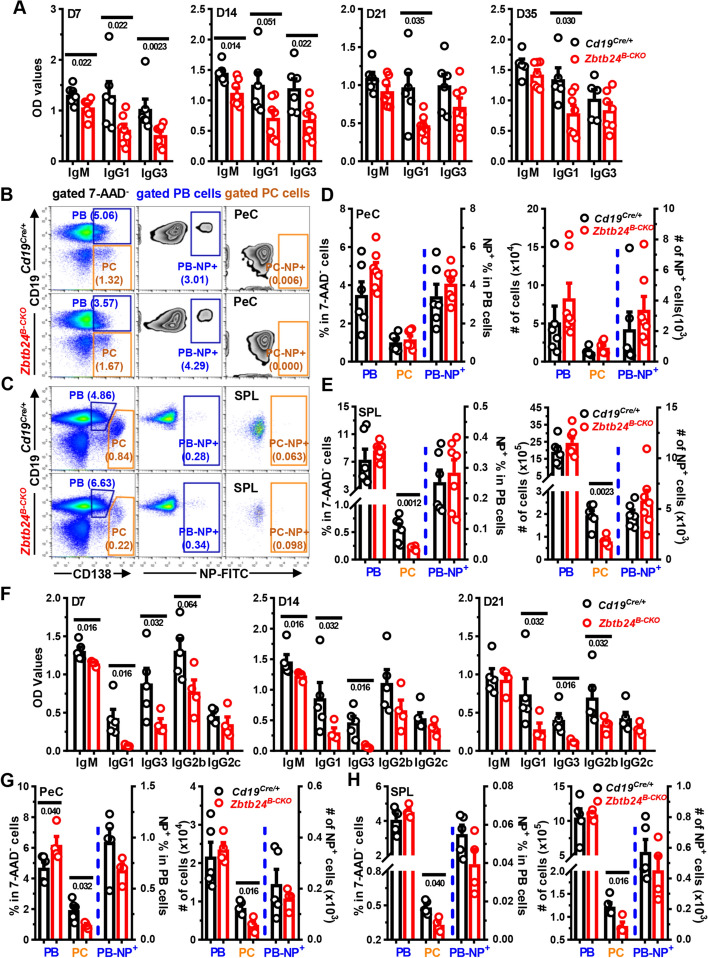
Fig. 3.
Significantly reduced antigen-specific antibody levels in Zbtb24B−CKO mice after TID-Ag immunization. Mice were intraperitoneally immunized with the type II TID-Ag NP-Ficoll (10 μg/200 μl PBS/mouse, A–E) or type I TID-Ag NP-LPS (20 μg/200 μl PBS/mouse, F–H) on D0. Blood was taken at indicated times and NP-specific antibodies in sera were determined by ELISA in plates coated with NP25-BSA. A, F Bar graphs showing the optical density (OD) values of NP-specific antibodies in diluted sera of Cd19Cre/+ versus Zbtb24B−CKO mice on indicated days post immunization with NP-Ficoll (A) or NP-LPS (F). B, C Representative pseudo/zebra-plots illustrating the gating strategies for CD19+CD138+ plasma blasts (PB)/CD19lowCD138high plasma cells (PC) and percents of NP+ cells within gated PB (PB-NP+) and PC (PC-NP+) cells in peritoneal cavities (PeC, B) or spleens (SPL, C) of mice on D35 post NP-Ficoll immunization. D, E, G, H, bar graphs showing the percentages and absolute numbers of PB and PC cells as well as the NP+ cells within gated PB/PC cells (PB-NP+/PC-NP+, respectively) in PeC (D, G) and SPL (E, H) of mice on D35 post NP-Ficoll (D, E) or on D21 post NP-LPS (G, H) immunization. Each symbol represents a single mouse of the indicated genotype (female, 10 weeks of age in A–E; and male, 9 weeks of age in F–H), and numbers below horizonal lines in bar graphs indicate P values. Data in A, F are representative of two independent experiments

