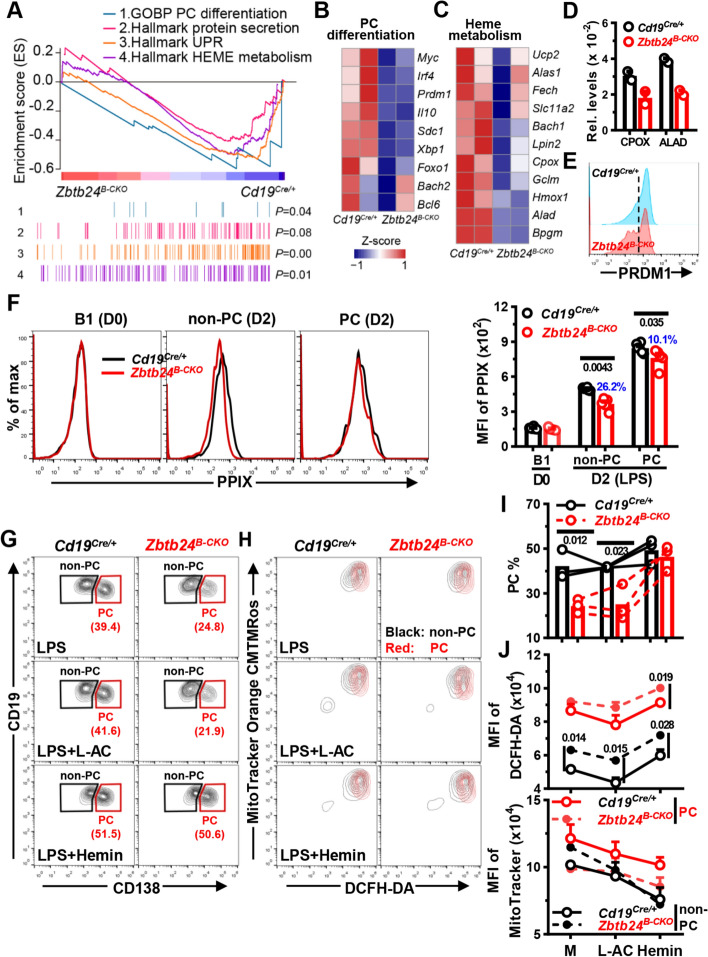
Fig. 6.
Zbtb24-deficiency blunts the differentiation of B1 cells into PCs through repressing the biosynthesis of heme. FACS-sorted peritoneal CD19+B220lowCD23− B1 cells were stimulated with 0.1 μg/ml LPS in 96-U bottom plate for 24 h (RNA-seq/Q-PCR, A-D) or 2–3 days without/with additional L-AC (250 μM)/Hemin (25 μM) to induce PC differentiation (E–J). A, GSEA plots of genes involved in PC differentiation, protein secretion, unfolded protein response (UPR), and heme metabolism in LPS-stimulated Zbtb24B−CKO versus Cd19Cre/+ B1 cells. B, C, heatmaps showing the z-score normalized on the raw expression counts of dysregulated genes regulating the differentiation of PC cells (B) or heme metabolism in cells (C) identified by RNA-seq analysis. The complete lists of enriched genes regulating UPR and heme metabolism were provided in Fig. S11C. D mRNA levels of CPOX and ALAD in Cd19Cre/+ versus Zbtb24B−CKO B1 cells determined by Q-PCR. E Representative half-offset histograms showing the levels of intracellular PRDM1 in LPS-stimulated B1 cells on D2. F Representative overlayed histograms (left) and cumulative data (right) showing the levels of intracellular PPIX in resting control versus Zbtb24B−CKO B1 cells (D0) or gated CD138− non-PC and CD138+ PC cells in LPS-stimulated cultures on D2. G, I Representative contour-plots (G) and bar graphs (I) showing the percentages of CD19lowCD138+ PCs in differentially cultured Cd19Cre/+ versus Zbtb24B−CKO B1 cells on D3. H Representative overlayed contour-plots showing the intracellular ROS levels (visualized by DCFH-DA) and mitochondrial mass/membrane potentials (detected by MitoTracker Orange CMTMRos) in gated CD138− non-PC (black) versus CD138+ PC (red) cells in cultured B1 cells on D3. J Bar graphs showing the ROS levels (MFI of DCFH-DA, top) or mitochondrial mass/membrane potential (MFI of MitoTracker, bottom) in gated non-PC/PC cells in Cd19Cre/+ versus Zbtb24B−CKO B1 cultures. Gates for CD138− non-PC and CD138+ PC were illustrated in G. Each dot represents a single mouse of the indicated genotype in D, F and I (male, 12–14 weeks of age), while results in J are expressed as mean ± SEM (n = 3). Numbers in F, I and J indicate P values determined by student t-test. Blue numbers in F denote percents of reduction. Data in E–J are representative of two experiments

