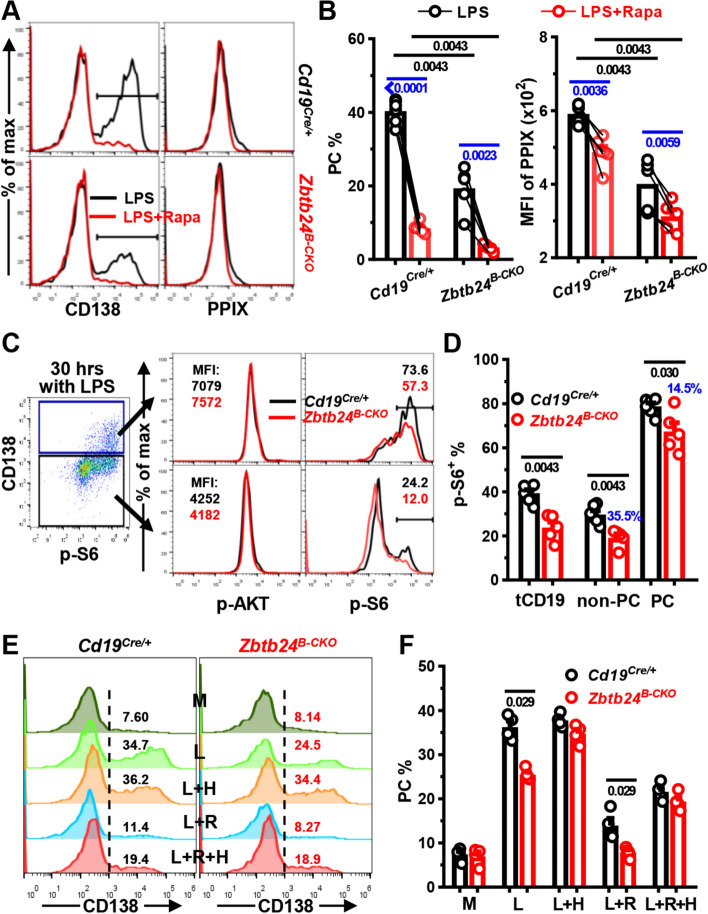
Fig. 7.
Zbtb24-ablation represses the mTORC1 activity, which promotes heme synthesis and PC differentiation of B1 cells. Peritoneal CD19+B220lowCD23− B1 cells were stimulated with 0.1 μg/ml LPS in the absence/presence of rapamycin (Rapa, 10 nM) for ~ 2 days (A–D). A, B Representative overlayed histograms (A) and bar graphs (B) showing the PC differentiation (left panel) and PPIX expression (right panel) in B1 cells cultured with LPS ± Rapa on day 2. C, D representative FACS-plots/overlayed histograms (C) and bar graphs (D) showing the expression of phosphorylated AKT (p-AKT) or ribosomal protein S6 (p-S6) in gated CD138+ PC or CD138− non-PC cells derived from Cd19Cre/+/Zbtb24B−CKO B1 cells after stimulation with LPS for 30 h. tCD19 denotes total CD19+ B cells and blue numbers in D indicate percent of reduction in gated Zbtb24B−CKO populations compared with the corresponding control counterparts. E, F Representative histograms (E) and bar graphs (F) showing the PC differentiation of B1 cells cultured in medium (M), LPS (L), and LPS plus Hemin (25 μM, L + H), rapamycin (10 nM, L + R) or both (L + R + H) for 2 days. Each dot represents a single mouse of the indicated genotype (12-week males in A–D, and 9-week females in E, F). Black/blue numbers below horizontal lines indicate P values determined by Mann–Whitney test or paired t-test, respectively. Data are representative of two experiments

