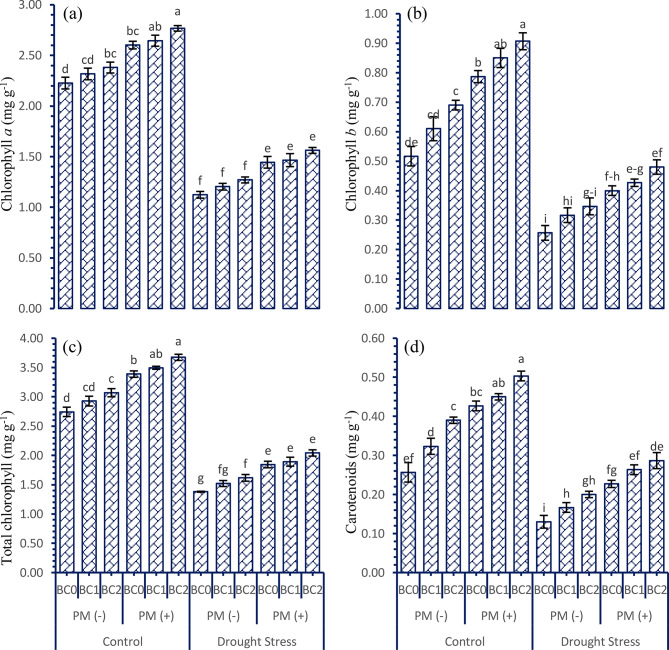
Fig. 3.
Interactive effect of various doses of soil applied biochar and peatmoss on the photosynthetic attributes of tobacco grown under drought stressed conditions. For each parameter, bars with the same letter are not significantly different across treatment means (p ≤ 0.05) based on a Tukey’s-HSD test. Capped lines denote the standard deviation of three replicates. PM (+); with peatmoss; PM (-); without peatmoss; BC0 = no biochar; BC1 = 150 mg kg− 1; BC2 = 300 mg kg− 1; a) chlorophyll a; b) chlorophyll b; c) total chlorophyll content; d) carotenoids content

