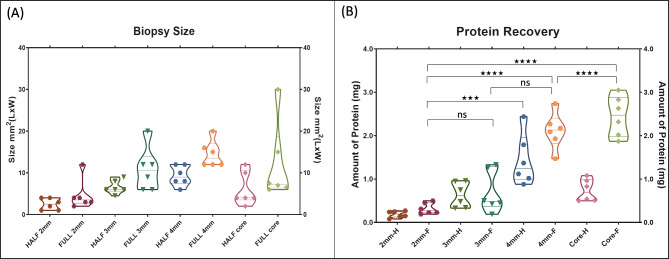
Fig. 2.
(A) Violin plot (truncated) of biopsy size (mm2) for the full and half samples of 2 mm, 3 mm and 4 mm punch biopsies and core biopsies. (B). Graph showing protein recovery (mg) for the full and half samples of 2 mm, 3 mm and 4 mm punch biopsies and core biopsies. Protein recovery from different tissue biopsies was analysed by Tukey’s multiple comparisons test (ns; not significant, ***; p value < 0.0001, ****; p value < 0.00001)

