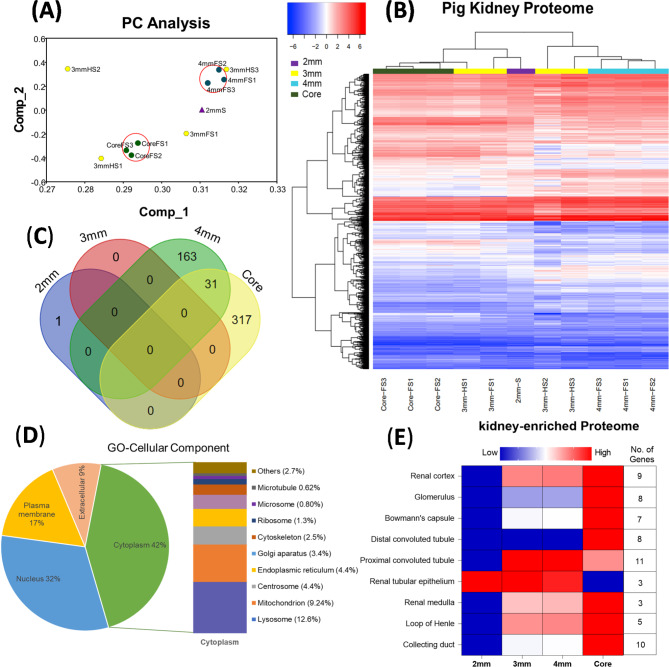
Fig. 4.
(A) The principal component analysis (PCA) was performed on the TMT intensity of 2 mm, 3 mm and 4 mm punch biopsies and core biopsies and samples are represented by individual colours and shapes. (B) Hierarchical cluster analysis depicts log2 values of TMT intensity ratios and represented according to the indicated row normalized colour scheme. (C) Venn diagram represents significant differentially expressed proteins (3854) in 2 mm, 3 mm, 4 mm and core biopsies groups (Fold change ≥ 1.5; P < 0.05). (D) Gene-Ontology (GO) cellular components analysis of the Pig Kidney proteome, area of a sector is proportional to the number of genes annotated to the corresponding GO category. (E) The expression of proteins specifically enriched in the kidney

