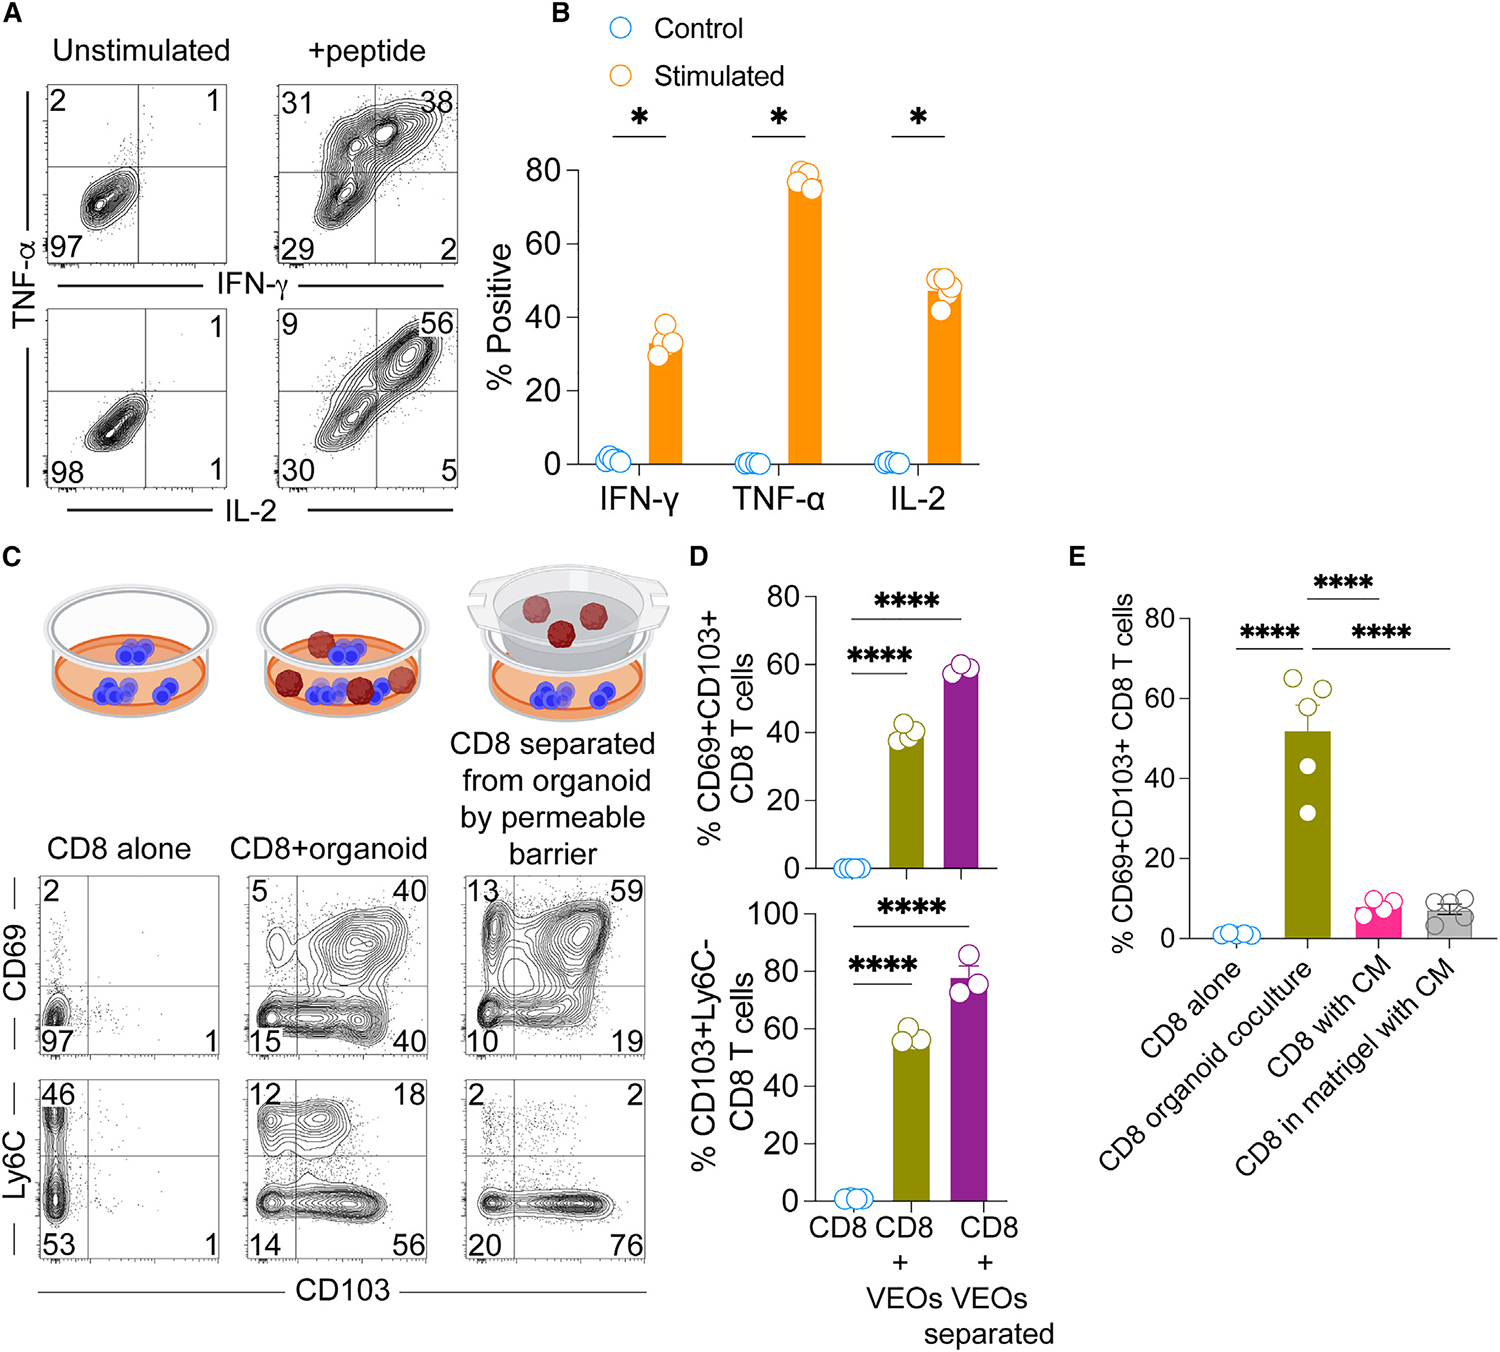
Figure 5. In-vitro-differentiated CD8 TRMs remain functional and could be generated in the absence of physical association with VEOs.

(A) Co-cultured CD8 T cells (day 11) were stimulated with antigenic peptide or unstimulated for 4 h in the presence of brefeldin A. Representative flow plots showing expression of the cytokines interferon (IFN)-γ, TNF-α, and IL-2 are shown. Plots are gated on live CD8β+ T cells.
(B) Percentage of stimulated cells expressing various cytokines are compared against unstimulated cells.
(C) Transwell assays were conducted whereby CD8 T cells in the bottom chamber were exposed to soluble mediators released from VEOs for a period of 10 days. This was compared to CD8 T cells cultured in the absence of VEOs and CD8 T cells embedded together with VEOs. Representative flow plots are gated on live CD8β + T cells showing robust adoption of the TRM phenotype when CD8 T cells were separated from VEOs by the semipermeable barrier.
(D) Bar graph showing percentage of positivity of various TRM phenotypes.
(E) Regular exposure to VEO conditioned medium (CM) for 10 days was not sufficient to drive CD69+CD103+ epithelial TRM phenotype. Bar graph comparing various CM treatments with the regular co-culture system is shown. Data are representative of three repeats with n = 3–6/condition (B and D) and two repeats with n = 5/condition (E). Bars indicate mean ± SEM. Multiple Student’s t tests (B). One-way ANOVA with Tukey’s multiple comparison test (D and E). *p < 0.05 and ****p < 0.0001.
