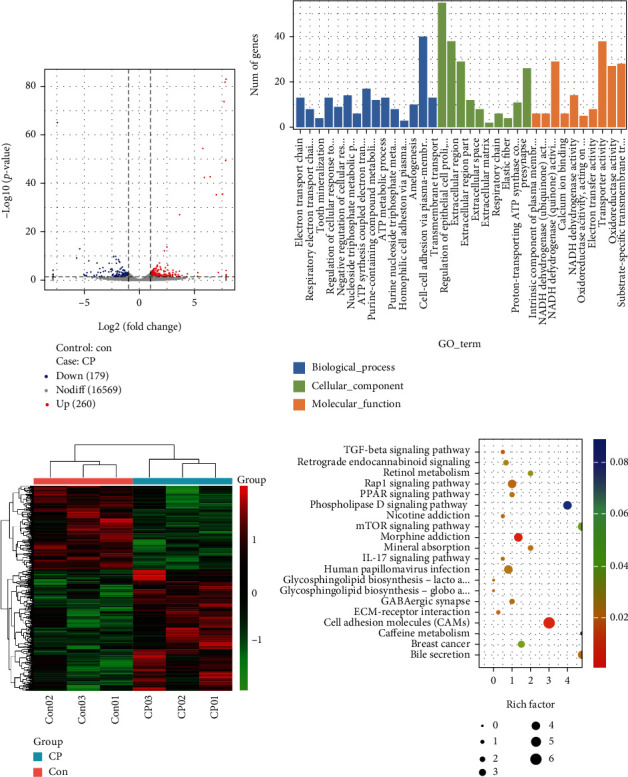
Figure 3.

Analysis of differentially expressed genes between Con and CP groups. (a) Display differentially expressed genes in the form of volcano map, including upregulated genes (red), downregulated genes (blue), and no differentially expressed genes (gray). (b) The clustering pattern analysis of differentially expressed genes. (c) GO terms enrichment analysis of differentially expressed genes. (d) KEGG pathway enrichment analysis of differentially expressed genes.
