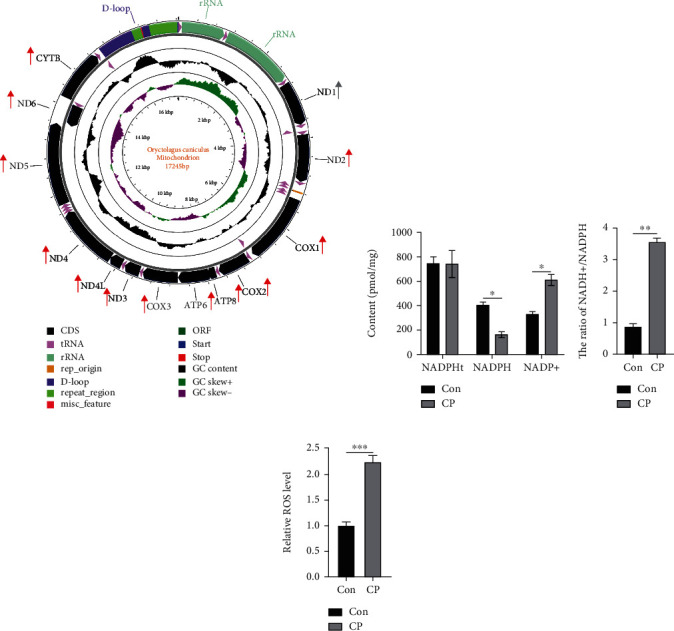
Figure 4.

Oxidative stress state of endometrial epithelial cells between Con and CP groups. (a) The map of mitochondria was drawn with CGView software, and then the genes of mitochondria were marked according to the results of transcriptome sequencing. These genes were all upregulated. The red ones represented significant (P value < 0.05), and the gray ones represented no significant (P value > 0.05). B&C NADPHt, NADPH, and NADP+ content and NADH+/NADPH value. (d) Reactive ROS level between Con and CP group.
