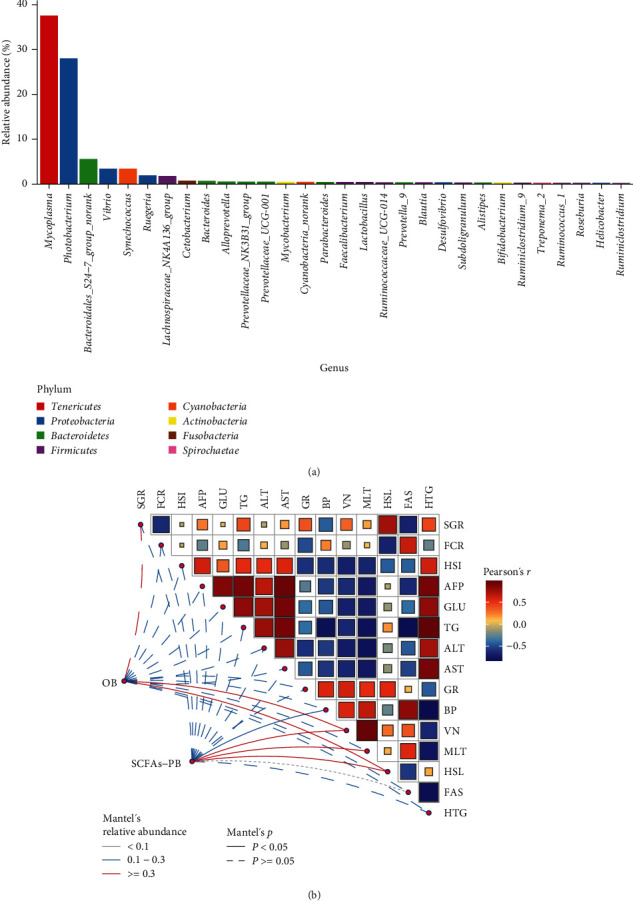
Figure 6.

(a) Relative abundance of top 30 genus of intestinal microbiota in T. ovatus fed experimental diets. (b) Mantel test of top 30 genus in abundance and physiological biomarkers (SCFAs-PB, SCFAs-producing bacteria, and OB). The dimensions of the square within the matrix represent the relativity (a red square signifies a positive correlation, while a blue square denotes a negative correlation. The deeper the color, the stronger the correlation). The lines outside the matrix reveals the correlation between the genus and physiological indicators (solid lines signify significant correlations, and dashed lines represent nonsignificant correlations).
