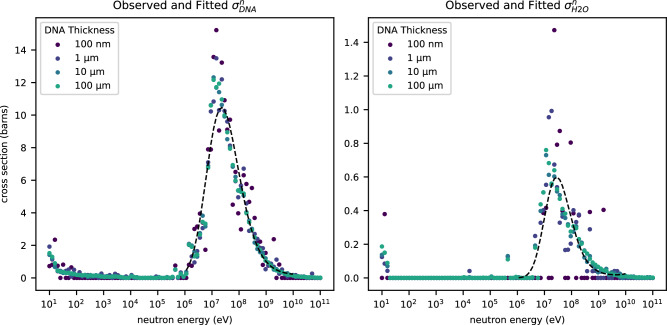
Fig. 2. Curve fitted simulation data.
Values for cross-sections and observed in the simulation are plotted as a function of neutron energy. The thickness of the simulated DNA is represented as a color gradient from purple (thinnest) to teal (thickness). Cross-sections are reported in barns, equivalent to 1 × 10⁻²⁸ m2. The fitted models of cross-section as a function of neutron energy are overlaid in black dashes. Source data are provided as a Source Data file.

