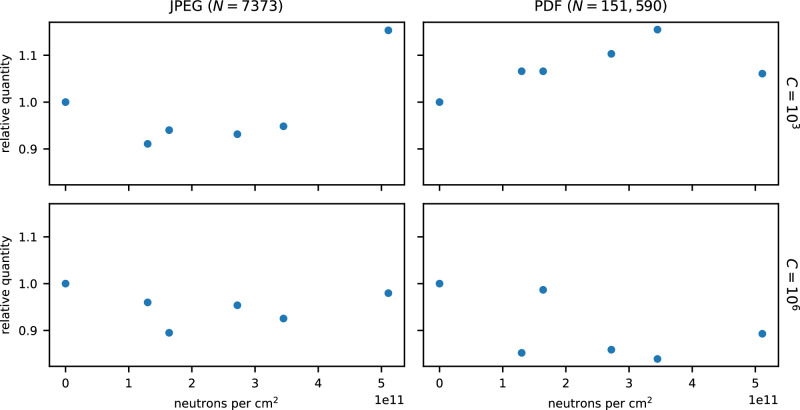
Fig. 5. The relative quantity of unbroken DNA remaining in each file as a function of neutron fluence.
DNA quantities were determined by qPCR with the resulting curves fit to a four-parameter logistic curve. No statistically significant correlation was observed (two-sided t-test, uncorrected acceptance criteria of p < 0.05) (N = 7373, C = 103: t(4) = 1.49, p = 0.21) (N = 7373, C = 106: t(4) = −0.20, p = 0.85) (N = 151, 590, C = 103: t(4) = 1.3, p = 0.26) (N = 151, 590, C = 106: t(4) = −1.3, p = 0.26). Source data are provided as a Source Data file.

