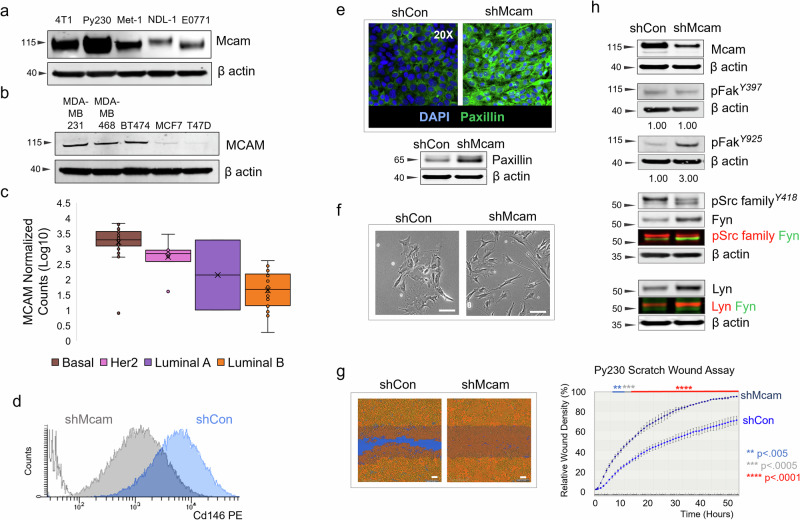
Fig. 1. Cellular and molecular signaling changes following Mcam KD in Py230 cells.
a Western blot of mouse breast cancer cell lines. b Western blot of human breast cancer cell lines. c Normalized MCAM counts in PDMs, stratified across breast cancer subtypes by PAM50 analysis. Whiskers mark the 5th and 95th percentile; boxes demarcate 25th, 50th and 75th percentile. d Surface Mcam expression (FACS) in control and Mcam KD Py230 cells. e Representative immunofluorescent Paxillin staining and western blot in Mcam KD Py230 cells and scrambled controls. f Phase contrast image of low density Mcam KD Py230 cells showing a more elongated spindeloid appearance than controls. Scale bar = 100 μm. g IncuCyte scratch wound assay indicates Mcam KD increases migration of Py230-A cells. Scale bar = 100 μm. Two-way ANOVA with Sidak’s multiple comparisons test between shCon and shMcam. ns not significant, *p < 0.05, **p < 0.01, ***p < 0.001, ****p < 0.0001. Error bars represent SD. h Western blot analysis from the same blot as panel (e) with the same β-actin of Mcam and altered focal adhesion related signaling in Mcam KD and control Py230-A cells.

