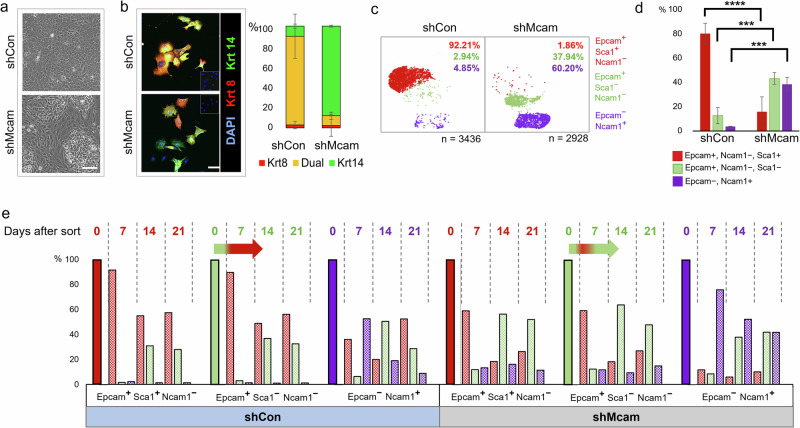
Fig. 2. Cell-state change following Mcam KD in Py230 cells.
a Phase contrast image of confluent Mcam KD and control Py230-A cultures. Scale bar = 100 μm. b Altered expression of lineage associated Krt8 (red) and Krt14 (green) in Py230-A Mcam KD cultures. Scale bar = 100 μm. Error bars represent SEM. n = 2. c scRNA-seq profiles from Py230-A control and Mcam KD cells reveal three major subpopulations that are identifiable by expression of previously described mammary lineage markers46. d FACS analysis in triplicates confirms proportional skewing among cells expressing these three marker proteins that mirrored subpopulations identified by scRNA-seq (n = 3 independent clones per genotype). Error bars represent SD. Two-way ANOVA with Tukey multiple comparison test: ns not significant, *p < 0.05, **p < 0.01, ***p < 0.001, ****p < 0.0001. e Interconversion of Py230-A subpopulations upon FACS separation and culture for 0, 7, 14 or 21 days. Horizontal arrows show immediate conversion of Epcam+ Ncam1low Sca1low cells to Epcam+Ncam1low Sca1high within seven days followed by reversion into Sca1low predominance in Mcam KD cells by day 14.

