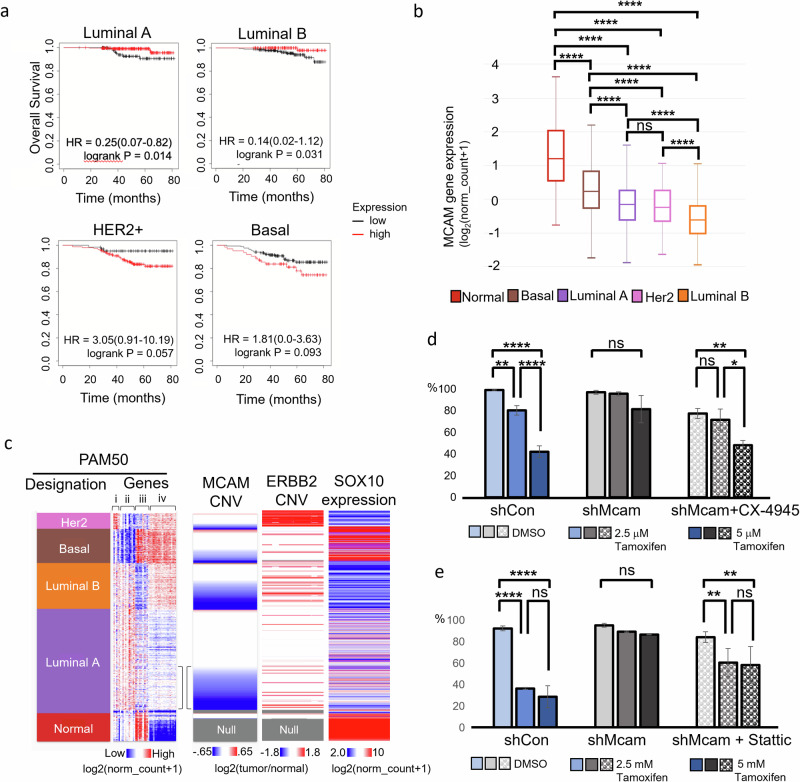
Fig. 5. MCAM loss marks aggressive luminal tumors.
a Kaplan-Meier analysis of TCGA data breast cancer data, stratifying patients receiving chemotherapy between high and low MCAM expression. b MCAM expression across breast cancer subtypes and normal tumor adjacent tissue in TCGA data. One-Way ANOVA with Tukey Kramer Multiple Comparisons. *p < 0.05, **p < 0.01, ***p < 0.001, ****p < 0.0001; n = 1247. Error bars represent SD. c TCGA breast cancer data organized by PAM50 designation and MCAM copy number variation (CNV) with expression of PAM50 gene set, ERBB2 copy number variation, and SOX10 expression. The PAM50 gene set can be broken down roughly into groups of genes related to: ERBB2 expression (i), luminal genes including hormone receptor expression (ii), basal genes (iii), and proliferation genes (iv). Brackets highlight ‘transitional’ Luminal A with increased proliferation and MCAM CNV loss. d, e IncuCyte proliferation assays of Py230-A control and Mcam KD cells with tamoxifen treatment shows that pretreatment with CX-4945 10 μM for 7 days (d), and pretreatment with Stattic 1 μM for 7 days (e) rescue the tamoxifen sensitivity in Mcam KD cells. One-Way ANOVA with Tukey Kramer Multiple Comparisons. *p < 0.05, **p < 0.01, ***p < 0.001, ****p < 0.0001. Error bars represent SD.

