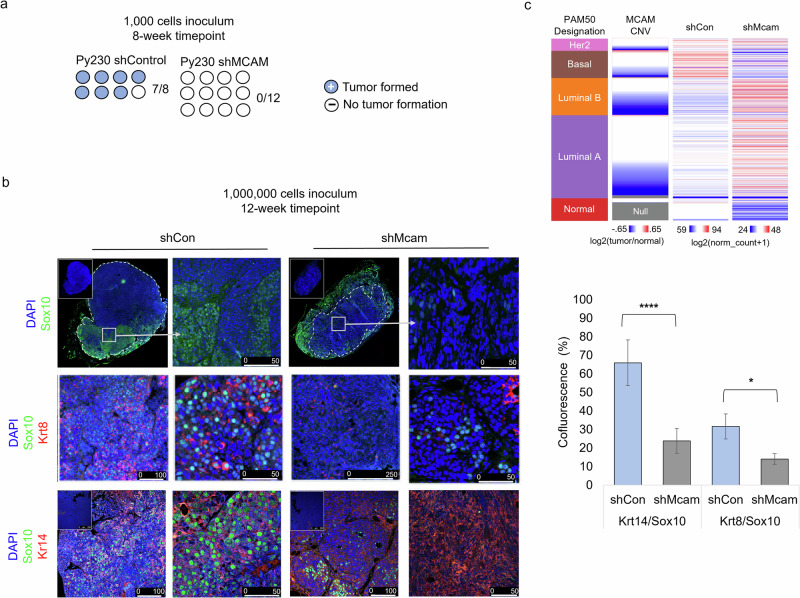
Fig. 6. Mcam promotes tumorigenic phenotypes and tumor cell plasticity.
a Reduced tumor seeding capacity of Mcam KD Py230 cells (1000 cell orthotopic injection) after 8 weeks of growth. shControl n = 8, shMcam n = 12. b Altered cell type distribution in tumors in vivo generated from orthotopic injection of 10e6 Py230 control or Mcam KD cells (left) n = 4 per condition. IHC analysis shows differential expression and distribution of cell type markers between control and Mcam KD tumors. Sox10+ stromal tumor margins are demarcated from tumor parenchyma (dashed lines). Regions of interest in low magnification images marked by white squares. Quantification of marker co-fluorescence utilizing representative tumors from (b) and additional 10e6 Py230 control or Mcam KD cell-derived tumors (right). Two-way t-test unequal variances test: *p < 0.05, **p < 0.01, ***p < 0.001, ****p < 0.0001. Error bars represent SD. c TCGA breast cancer data organized by PAM50 designation, MCAM copy number loss, and relative expression of genes with ten greatest rank changes up or down between control and shMcam Py230 tumor grafts (bulk RNASeq). Two-way ANOVA p < 0.0001.

