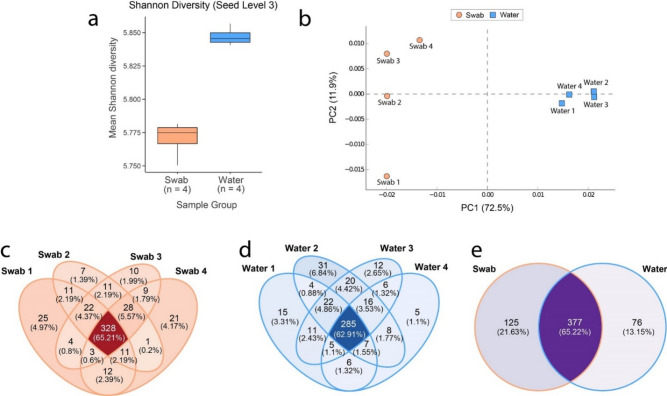
Fig. 5.
Diversity and abundance measures of Rio São Benedito water and piranha anal swab samples for functional genes at SEED level 3. (a) Alpha diversity represented by Shannon Index between anal swab and river samples. (b) Beta diversity represented by principal component analysis plot showing differences in the community metabolic structure from anal swab and river water samples. The axes show the Principal Components (PC), with PC1 and PC2 respectively explaining 72.5% and 11.9% of the total variance. Only entries where at least 10 reads were classified within a given sample from either swab or water metagenomes were used for diversity measures. Venn diagram representing unique and common counts of functional genes categorized at SEED level 3 between (c) anal swabs, (d) water and (e) both sampling groups overall. For Venn Diagram counts, only entries where at least 10 counts were classified to a category within an individual swab or river sample were included.

