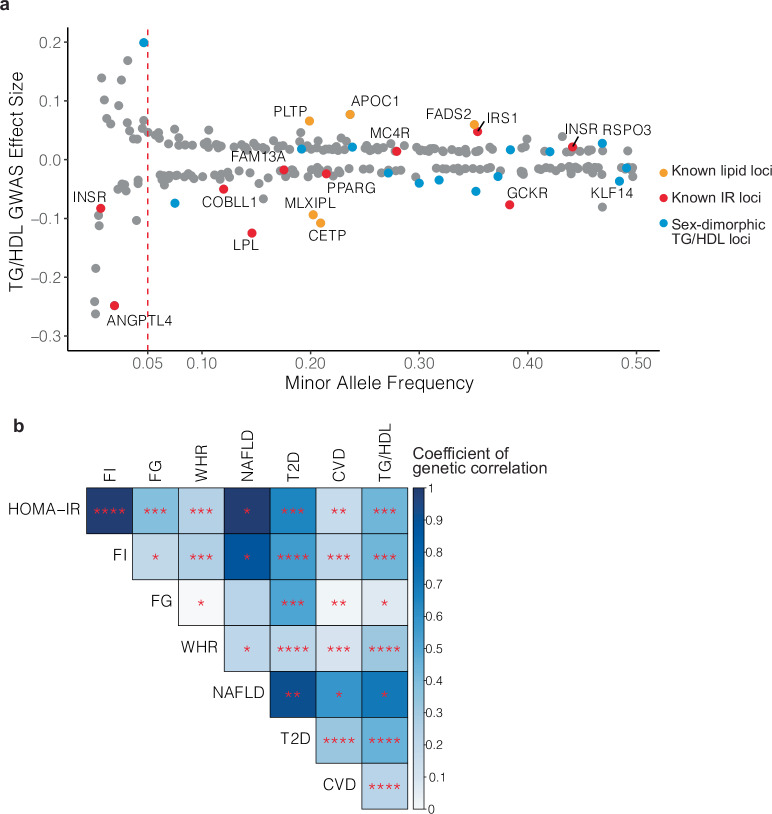
Fig. 1. GWAS for TG/HDL in 382,129 UK Biobank participants identifies 251 associated loci.
a Genetic architecture of 251 TG/HDL associated loci identified in the UK Biobank (n = 382,129 participants). Shown are the effect sizes of the lead SNPs plotted according to minor allele frequency. Previously identified lipid and insulin resistance (IR) loci are colored orange and red, respectively. Loci with sex-dimorphic association signals are highlighted in blue (n = 17/251). b Genetic correlations of TG/HDL with other surrogate measures of insulin resistance: fasting insulin (FI), fasting glucose (FG), waist-hip ratio (WHR), and metabolic diseases: non-alcoholic fatty liver disease (NAFLD), type 2 diabetes (T2D), and cardiovascular disease (CVD). LD Score regression was used to estimate the p-values and the coefficients of genetic correlation. Color intensity represents the magnitude of the coefficient of genetic correlation, and statistical significance is indicated in the following bins: ****p < 1e-20, ***p < 1e-5, **p < 0.001, *p < 0.05. TG/HDL shows a strong positive genetic correlation with surrogate markers of insulin resistance and metabolic diseases.

