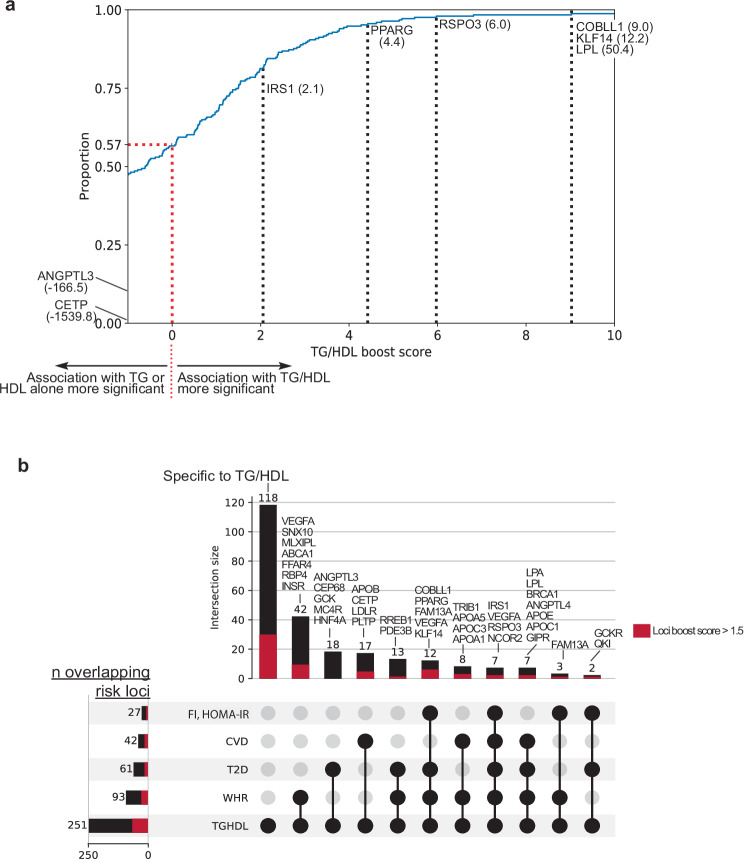
Fig. 2. Prioritizing “boosted” TG/HDL associations to identify insulin resistance loci.
a Cumulative distribution plot of 251 TG/HDL loci according to TG/HDL Boost score. Boost scores greater than 0 signify a stronger association with TG/HDL than TG or HDL alone. Boost scores less than 0 signify the opposite. Among the 251 TG/HDL loci, 109 (43%) have a boost score > 0 (dotted red line). Notable lipid regulation genes (TG:ANGPTL3, HDL:CETP) have highly negative boost scores, whereas known insulin resistance genes show positive boost scores. b Upset plot showing intersection of the 251 identified TG/HDL loci with previous GWAS for surrogate insulin resistance markers and metabolic diseases: fasting insulin (FI), HOMA-IR, coronary artery disease (CVD), type 2 diabetes (T2D), waist-hip ratio (WHR). (Left) Total number of loci that overlap from each study with the 251 TG/HDL loci. (Top) Number of loci within each intersecting group of studies denoted by black circles with selected known insulin resistance loci labeled above. The proportion of each bar comprised of loci with top-quartile boost scores (>1.5) is highlighted in red. For example, TG/HDL, T2D, and FI share 2 loci, GCKR and QKI, in common.

