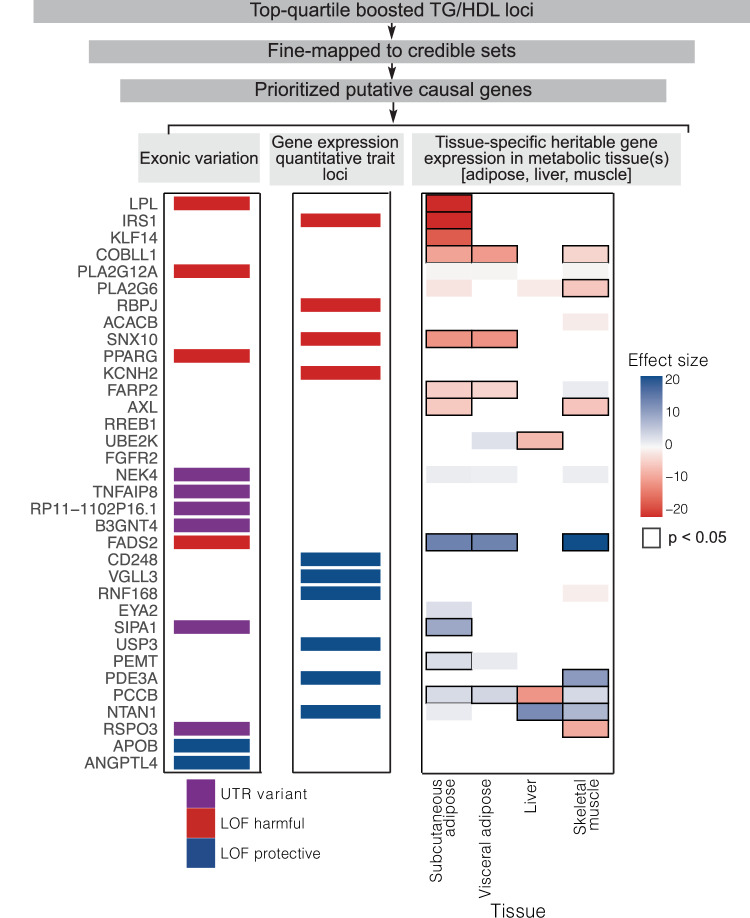
Fig. 3. Causal gene identification and integrative genomics to infer direction-of-effect of “boosted” TG/HDL loci.
Overview of the gene prioritization strategy for 251 TG/HDL associated loci. The top quartile of TG/HDL boosted loci (n = 62) was selected for fine mapping to obtain 95% credible sets of causal SNPs (n = 57). Of the loci with at least one causal variant identified from fine-mapping (n = 50), causal genes were assigned by incorporating genomic and functional annotations, including exonic variation and expression quantitative trait loci (eQTLs). Direction-of-effect on insulin resistance and tissue specificity of causal genes was assigned by examination of the following gene level evidence: (left) causal variants in exons were annotated as UTR (untranslated region; purple) or protein-coding with loss-of-function (LOF harmful: LOF increases TG/HDL (red); LOF protective: LOF decreases TG/HDL (blue)). (Middle) Causal variants that were eQTLs are assigned as LOF harmful or LOF protective if decreasing expression increases (red) or decreases TG/HDL (blue). (Right) Association of tissue-specific predicted gene expression with TG/HDL in the UK Biobank. All statistics were derived using a weighted linear regression model. Direction and magnitude of effect are represented by color, with positive and negative associations of gene expression with TG/HDL shown as blue and red, respectively, and darker shades demonstrating stronger effect sizes. Significant associations are outlined in black.

