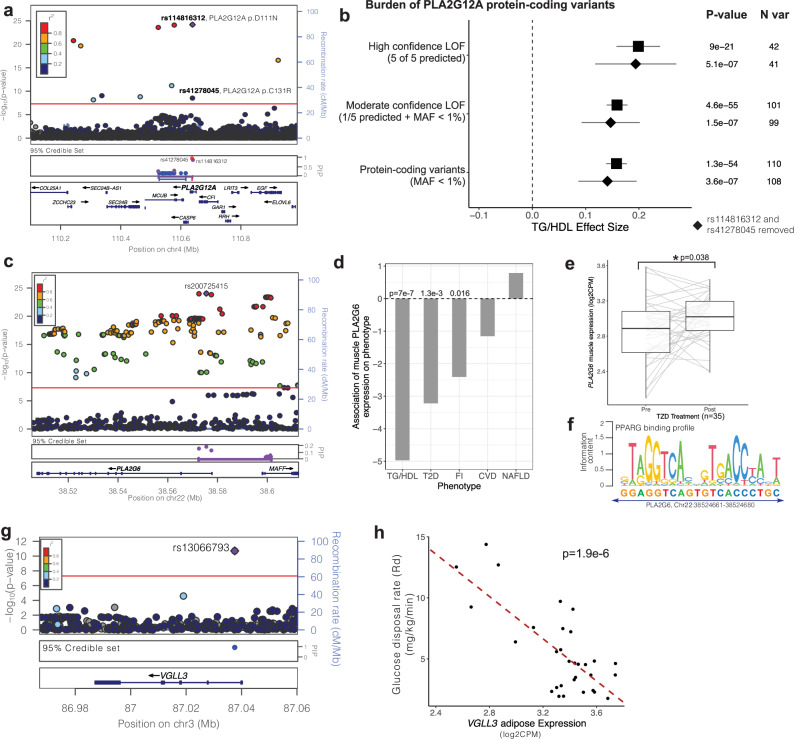
Fig. 4. Evaluation of TG/HDL-associated loci nominates PLA2G12A, PLA2G6, and VGLL3 as novel insulin resistance genes.
a LocusZoom plot of the PLA2G12A TG/HDL locus. The purple diamond represents the lead SNP, and color represents the linkage disequilibrium between each variant with the lead SNP. The PLA2G12A locus contains three 95% credible sets (depicted as red, purple, blue), with the top two causal SNPs rs114816312 (PIP = 0.7) and rs41278045 (PIP = 1) encoding PLA2G12A missense variants. b PLA2G12A loss-of-function (LOF) burden tests in the UK Biobank exome sequenced individuals with increasing confidence (stringency) to define LOF variants. High confidence LOF variants were called deleterious by 5 out of 5 bioinformatics prediction tools (see “Methods”), Moderate confidence LOF variants were those called deleterious by at least 1 bioinformatic prediction tool and had minor allele frequency (MAF) < 1%. Standard burden test results are indicated by squares, and diamonds represent sensitivity analyses removing the top causal variants rs41278045 and rs114816312. 95% confidence intervals (±1.96*standard error) are shown as whiskers. P-values (linear ridge regression models) and number of variants for each analysis are listed. c LocusZoom plot and 95% credible set for the PLA2G6 TG/HDL locus. d Associations of predicted muscle PLA2G6 expression on TG/HDL, type 2 diabetes (T2D), fasting insulin (FI), coronary artery disease (CVD), and non-alcoholic fatty liver disease (NAFLD) (Bayesian sparse linear mixed model). e Upregulation of skeletal muscle PLA2G6 upon TZD treatment in 35 biopsied clinical study participants (fold-change = 1.11, *p = 0.038; linear mixed model). For each boxplot, the middle line in the box indicates the median, the box boundaries represent the 25th and 75th percentiles, and the whiskers are the 5th and 95th percentiles. f PPARG consensus motif overlaid over a high-scoring matching sequence 2231 bp 5’ of the PLA2G6 transcription start site. g LocusZoom plot and 95% credible set for the VGLL3 TG/HDL locus. h Association of adipose tissue VGLL3 expression with glucose disposal rate (Rd) measured by hyperinsulinemic-euglycemic clamp among 31 biopsied participants (b = −8.7, p = 1.9e-6; linear model).

