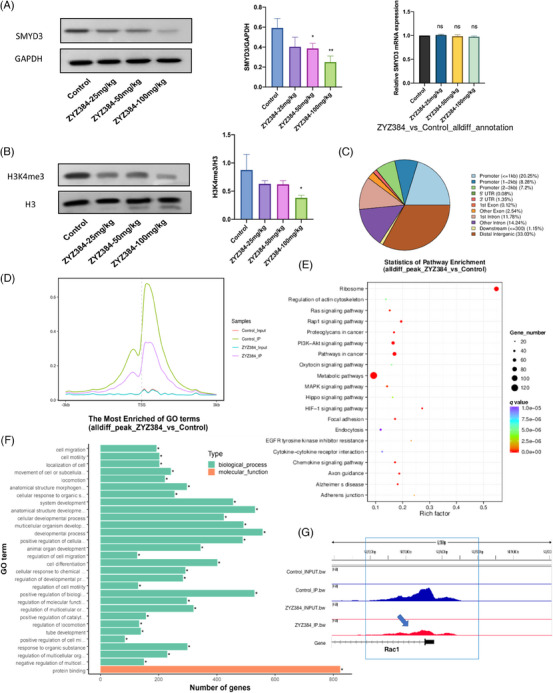
FIGURE 5.

ZYZ384 inhibition effect on SMYD3 and H3K4me3 occupancy of annotation genes. (A) SMYD3 expression level in tumor tissue following treatment with ZYZ384. (B) H3K4me3 expression level in tumor tissue after treatment with different dosages of ZYZ384. (C) Distribution of peaks at gene functional regions. (D) Relative reads of gene body distribution (E) KEGG enrichment analysis. (F) GO enrichment analysis. (G) Visualization of reads comparison. Statistical results of related genes data are expressed as mean ± SEM. GO, Gene Ontology; KEGG, Kyoto Encyclopedia of Genes and Genomes. *: p < 0.05; **: p < 0.01; one‐way ANOVA analysis.
