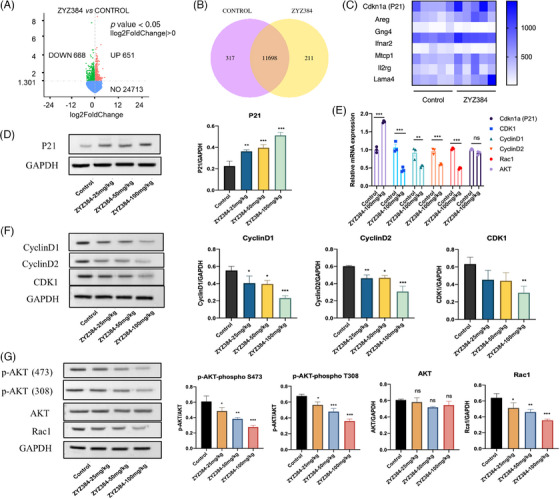
FIGURE 6.

Molecular mechanism of ZYZ384 antitumor activity. (A) Differential gene volcano plot. (B) Venn diagram of gene coexpression. (C) Differentially gene expressed as presented as a clustering heat map. (D) P21 expression. (E) The mRNA level of related genes was assessed using quantitative real‐time reserve transcription polymerase chain reaction followed by (F, G) Western blot protein expression analysis. Statistical results of related genes data are expressed as mean ± SEM. *: p < 0.05; **: p < 0.01; ***: p < 0.001; one‐way ANOVA analysis.
