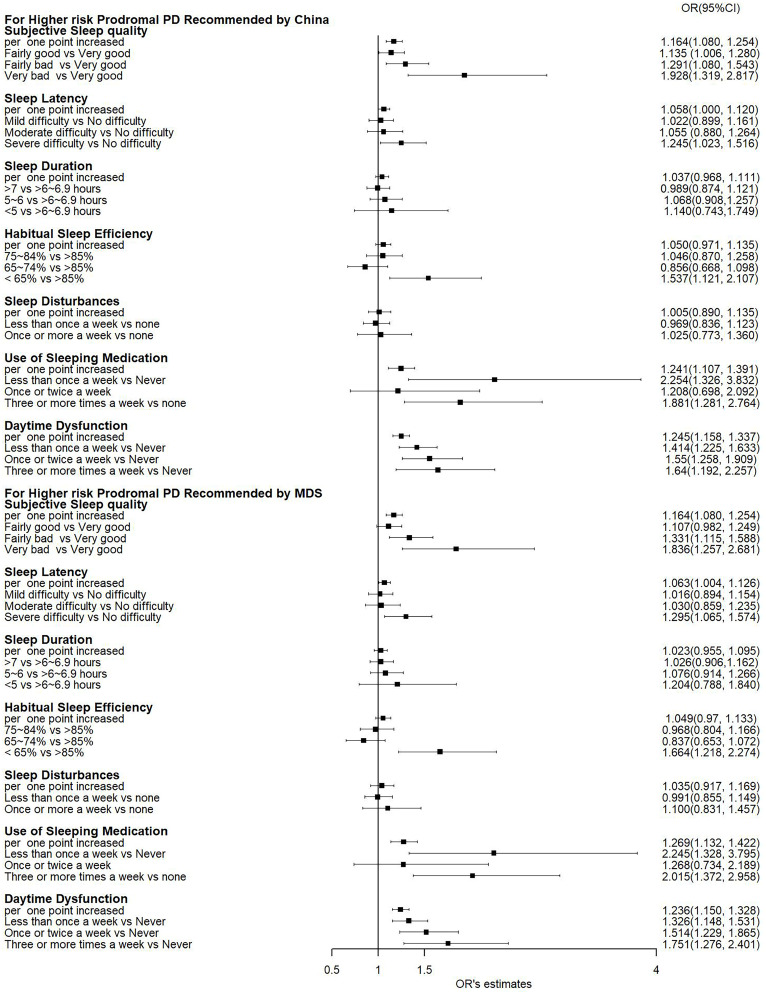
Figure 2.
A forest plot presenting the associations between individual PSQI components and an increased probability of prodromal PD.
Notes: ORs and 95% CIs were generated by a logistic regression model after adjusting for age, sex, education level, physical activity, body mass index, fast plasma glucose, high- and low-density lipoprotein cholesterol, and hypertension. PSQI, Pittsburgh Sleep Quality Index; MDS: Movement Disorder Society; PD: Parkinson’s disease.

