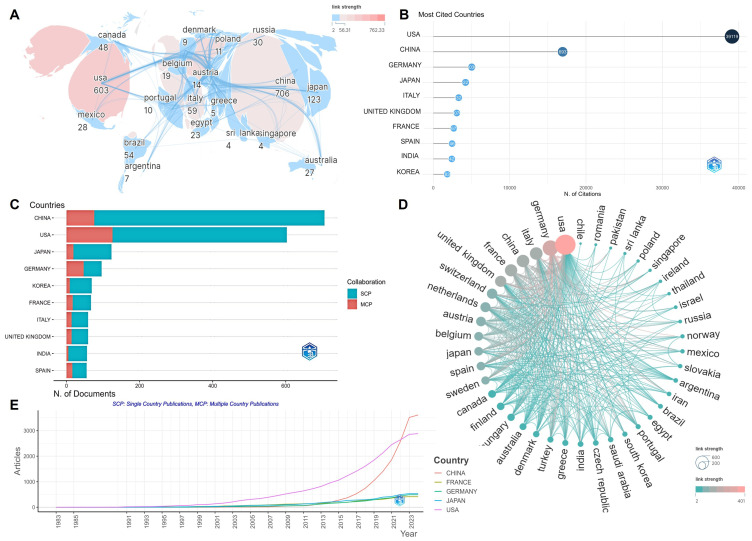
Figure 2.
Visualization results of countries/regions. (A) National/regional cooperation depicted with node size representing the number of articles and color depth indicating collaboration intensity. (B) Top ten countries with the highest citation counts. (C) Countries of corresponding authors. (D) In the country cooperation network, node size reflects collaboration intensity. (E) Country production trends over time.

