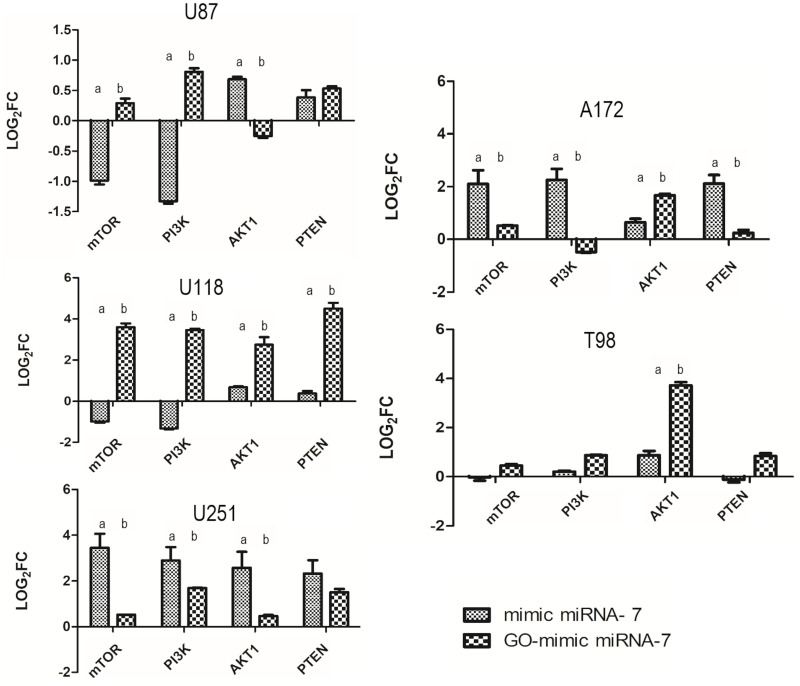
Figure 11.
mTOR, PI3K, AKT1, PTEN gene expression profile in U87, U118, U251, A172 and T98 glioblastoma cell lines following mimic miRNA-7 or GO-mimic miRNA-7 nanosystems treatment. a,b values within bars with different superscripts are significantly different, p ≤ 0.05. Values were normalized to the housekeeping gene GAPDH.
Abbreviation: GO, graphene oxide.

