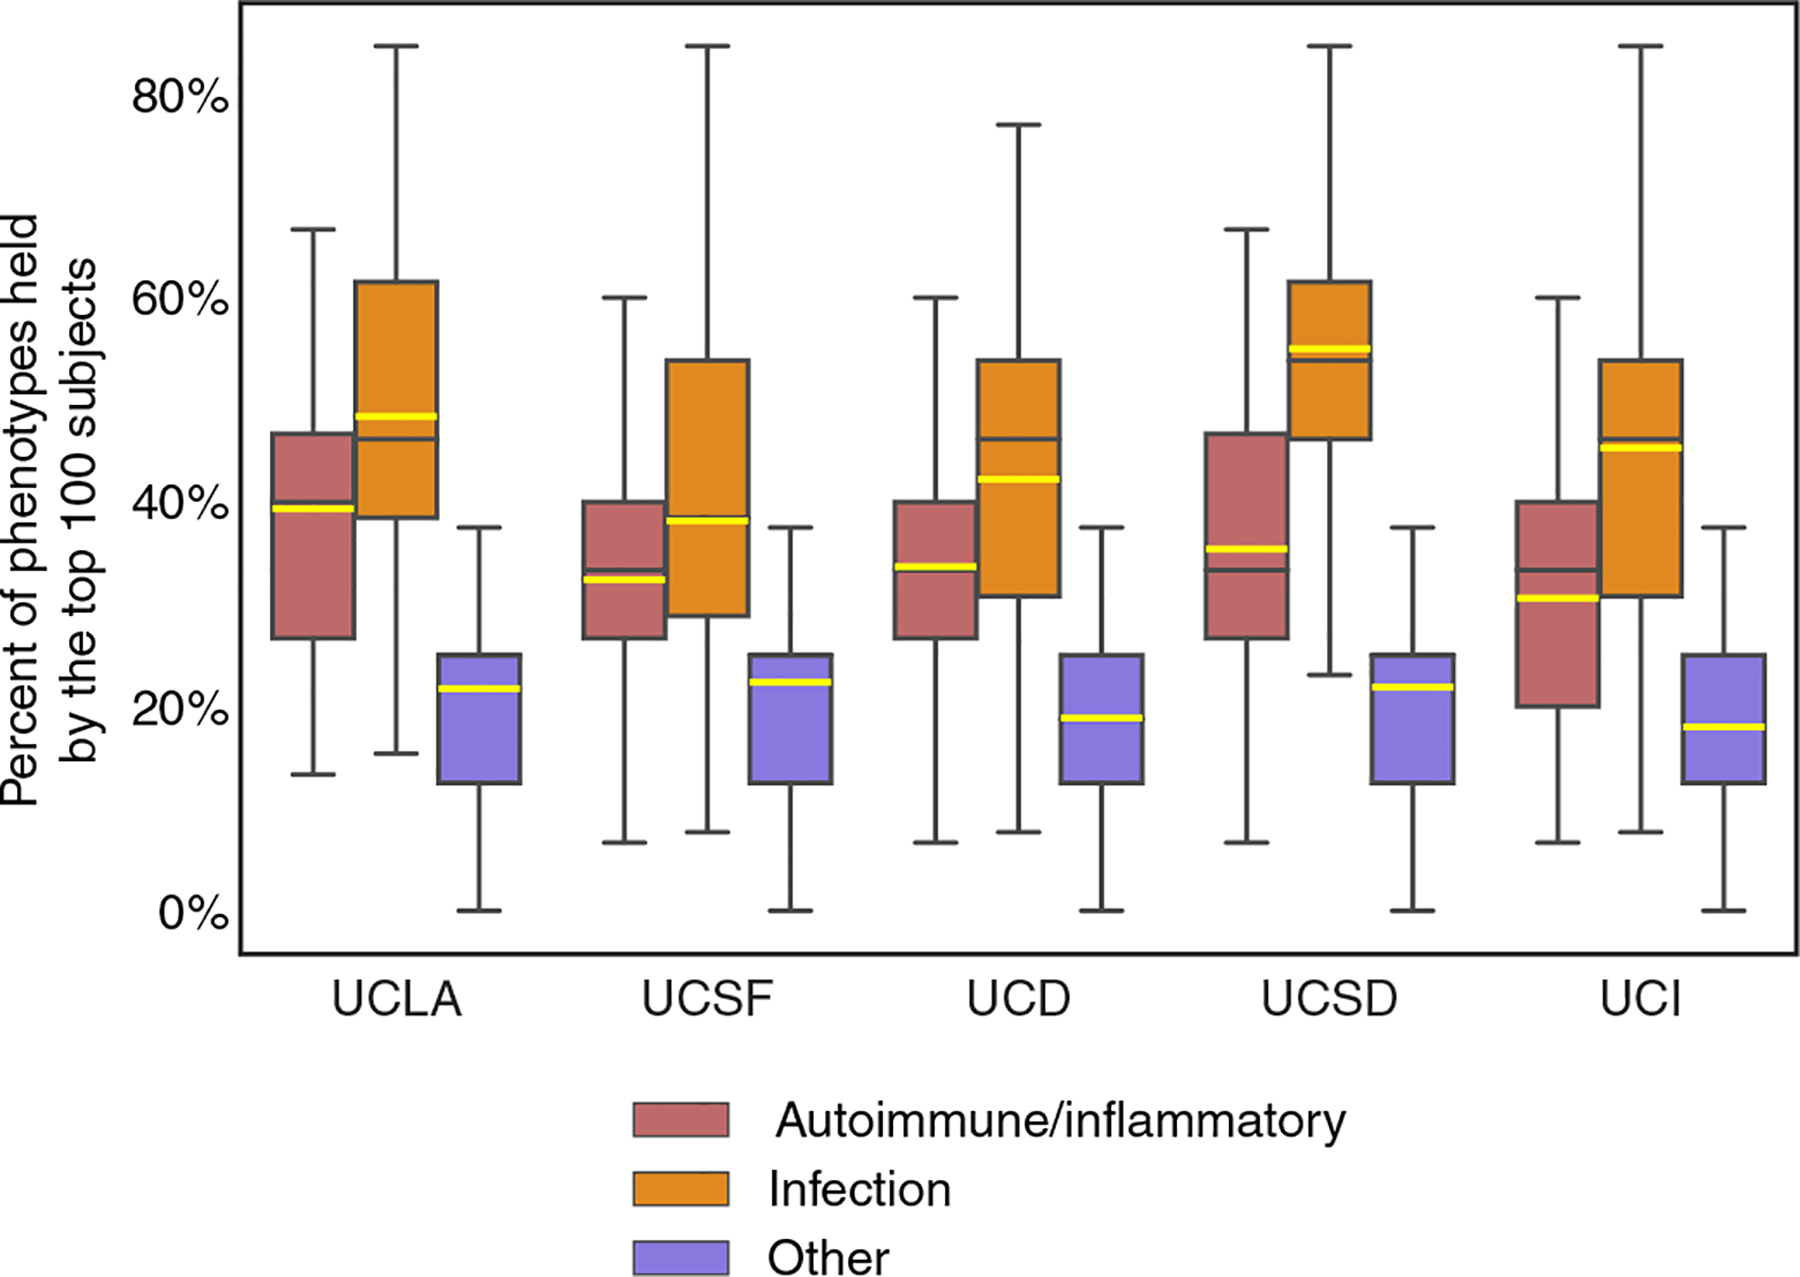
Fig. 7. Burden of CVID phenotypes among the top 100 ranked individuals at each institution.

To externally validate and demonstrate broad applicability in databases outside UCLA, we examined the clinical phenotypes for each individual of the top 100 ranked at each institution for features of autoimmunity, infection, and other (the phenotypes shown in Fig. 6) from their electronic records. Averages (yellow line), 25th to 75th percentiles (box), median (black line), and range (whiskers) are shown. For example, each UCSF individual ranked in the top 100 by PheNet has in their medical record on average 35% of the 14 assessed infection phenotypes and 40% of the 17 assessed autoimmunity/inflammation phenotypes.
