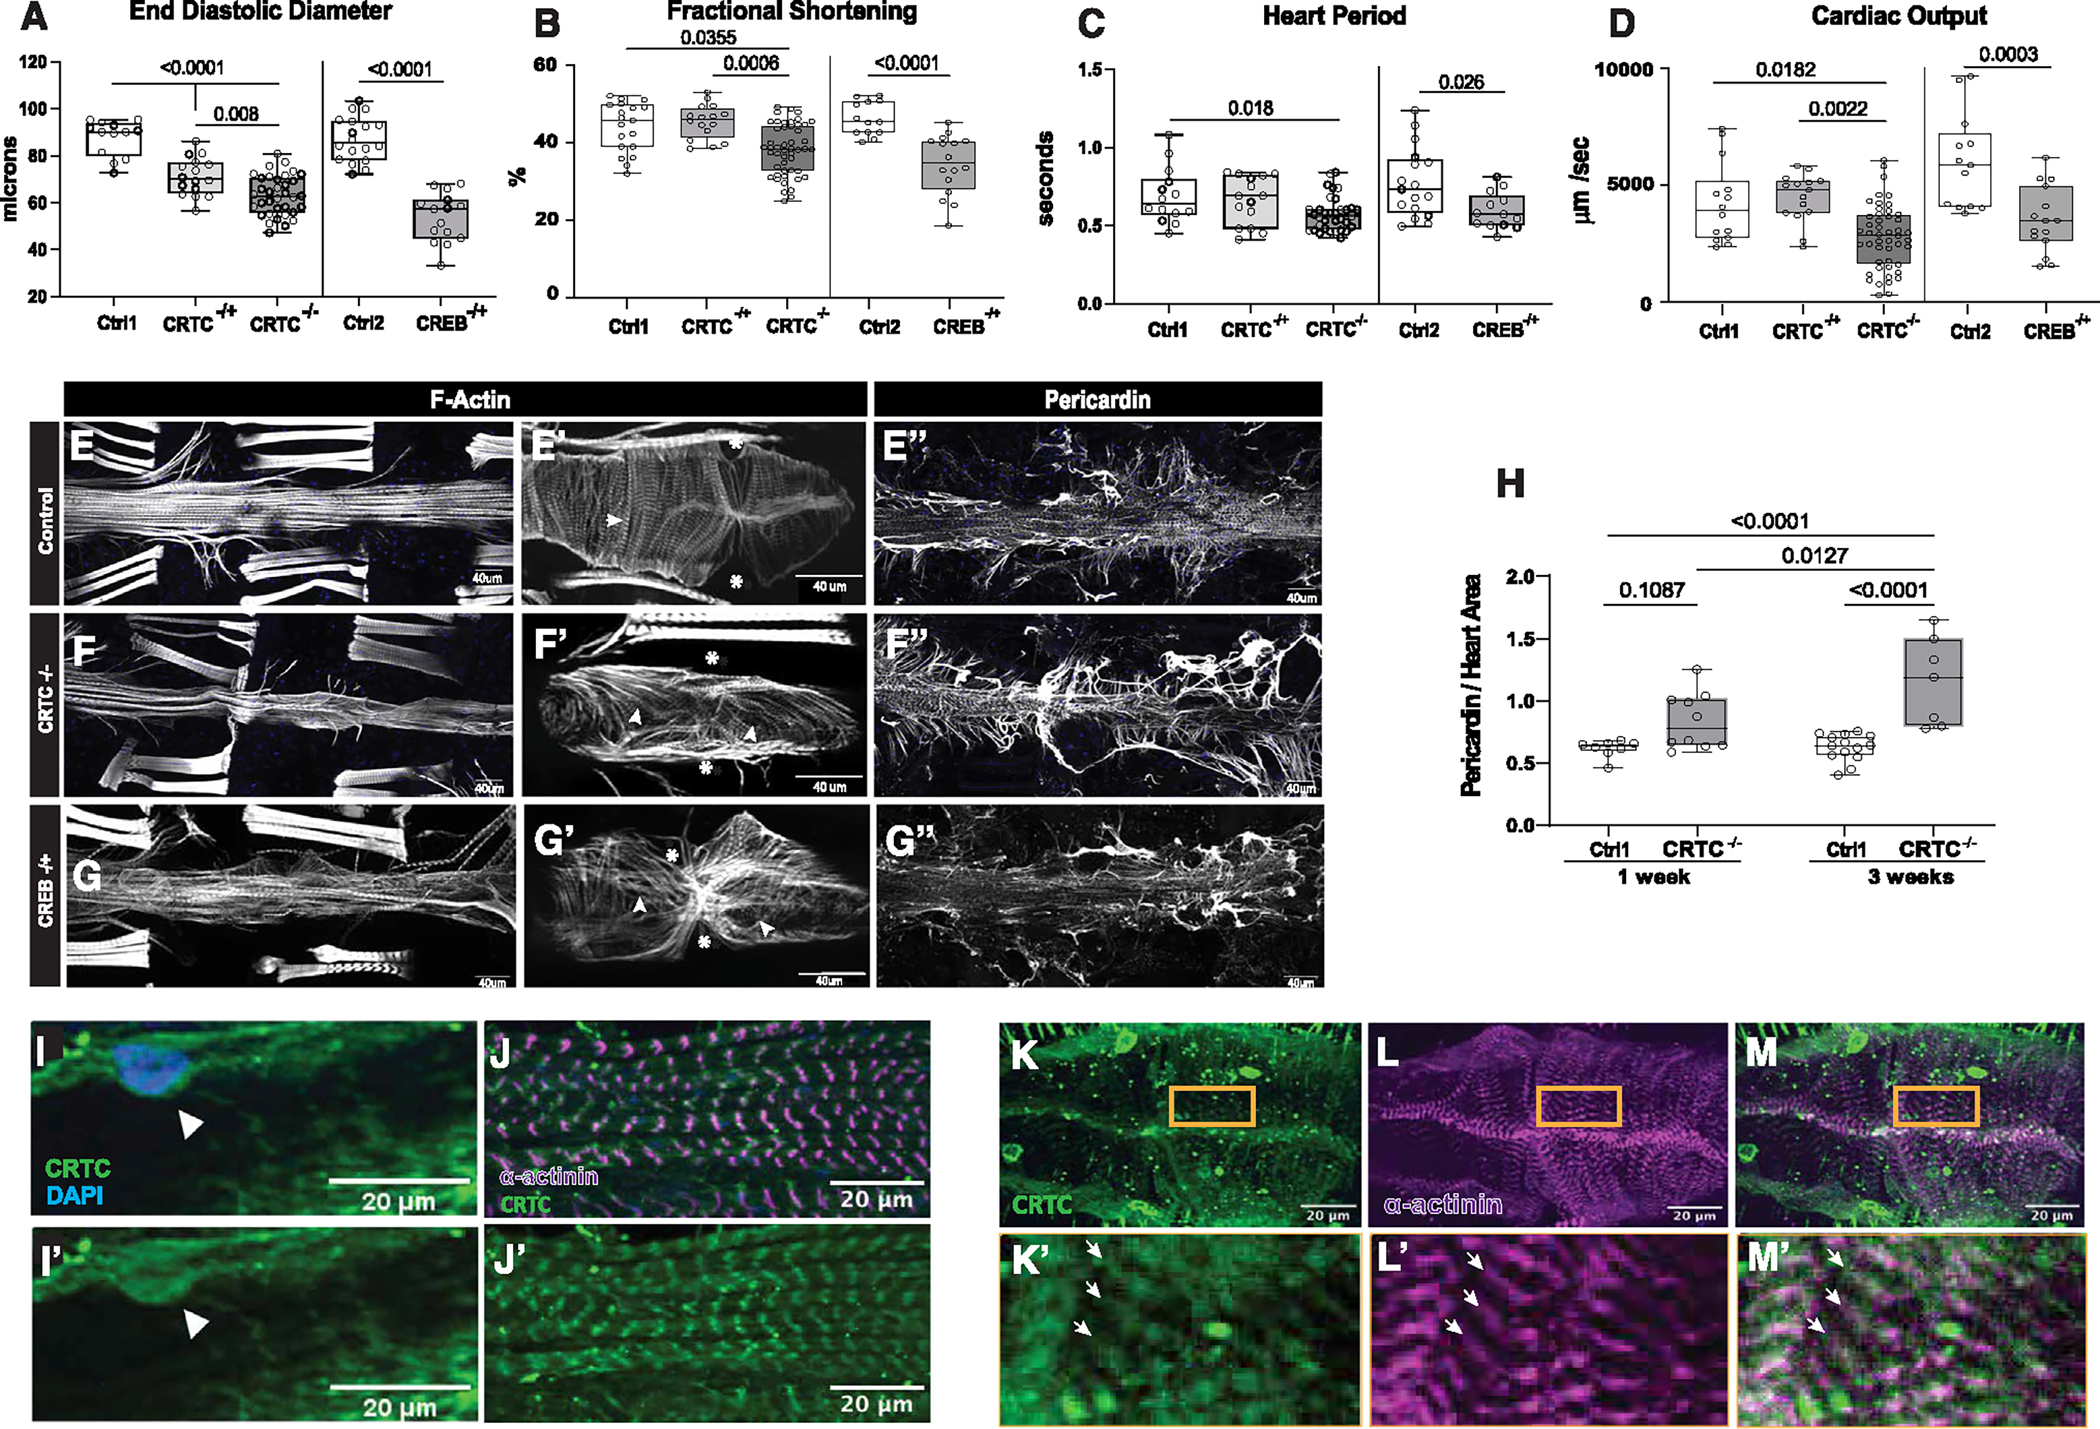
Figure 1. CRTC KO causes cardiac dysfunction and fibrosis that are mimicked by CREB KO.

(A) (Left) KO of CRTC significantly reduced end diastolic diameter (EDD) in hearts from both heterozygous (−/+) and homozygous (−/−) mutants compared to genetic background controls (w1118). (Right) Similar cardiac restriction was observed in hearts from CREB−/+ heterozygotes.
(B) (Left) Fractional shortening was reduced in hearts from CRTC−/− mutants and (right) in CREB−/+ heterozygotes.
(C) (Left) Heart period (one contraction cycle) was reduced in CRTC-KO flies, but not in CRTC heterozygotes. (Right) CREB−/+ heterozygote flies also showed significant reductions in HP.
(D) (Left) Cardiac output was significantly reduced in CRTC−/− mutants and (right) in CREB−/+ heterozygotes.
(For A–D, flies were 1 week of age; p values by one-way ANOVA for CRTC mutants and two-tailed, unpaired t tests for CREB mutants; plots show all data points, max, min, median, and p values.)
(E) F-actin staining with phalloidin reveals the cardiac tube and (E′) tightly packed circumferential fibers (arrowhead) in an optical section from a single chamber in a control. (Asterisks denote position of ostia, anterior is left.) (E″) Control stained for collagen IV (pericardin) reveals the extensive extracellular matrix that surrounds the heart.
(F) F-actin staining in a CRTC mutant exhibiting cardiac restriction and (F′) disorganized myofibrils (arrowheads); ostia are also malformed (asterisks). (F″) The collagen matrix in CRTC−/− mutants is significantly expanded, especially in the posterior region (right).
(G) Cardiac chamber from a CREB heterozygote mutant showing cardiac restriction and (G′) disorganized myofibrils with gaps (arrowheads) and malformed ostia (asterisks). (G″) Collagen network in the CREB−/+ heterozygotes is expanded, especially in the posterior region (right).
(For E–G″, scale bars represent 40 μm).
(H) Quantification of collagen area normalized to cardiac actin area is increased in CRTC mutants compared to controls at 1 week (p values by two-tailed, unpaired t tests).
(I and I′) Immunohistochemistry shows nuclear CRTC localization in cardiomyocytes (arrowheads, CRTC staining is green, nuclear staining is blue).
(J and J′) Co-staining of non-myocardial ventral longitudinal fibers with CRTC and α-actinin antibodies shows CRTC (green) strongly associated with α-actinin in Z bands (magenta).
(K–M) Optical sections through one chamber of the heart stained for CRTC (K, green), α-actinin (L, magenta), and (M) merged image. (K′-M′) Higher magnification of regions in yellow rectangles. Arrows show location of anti-CRTC staining (K′), α-actinin staining (L′), and co-localization (M′, white).
(For I–M′, scale bars represent 20 μm).
