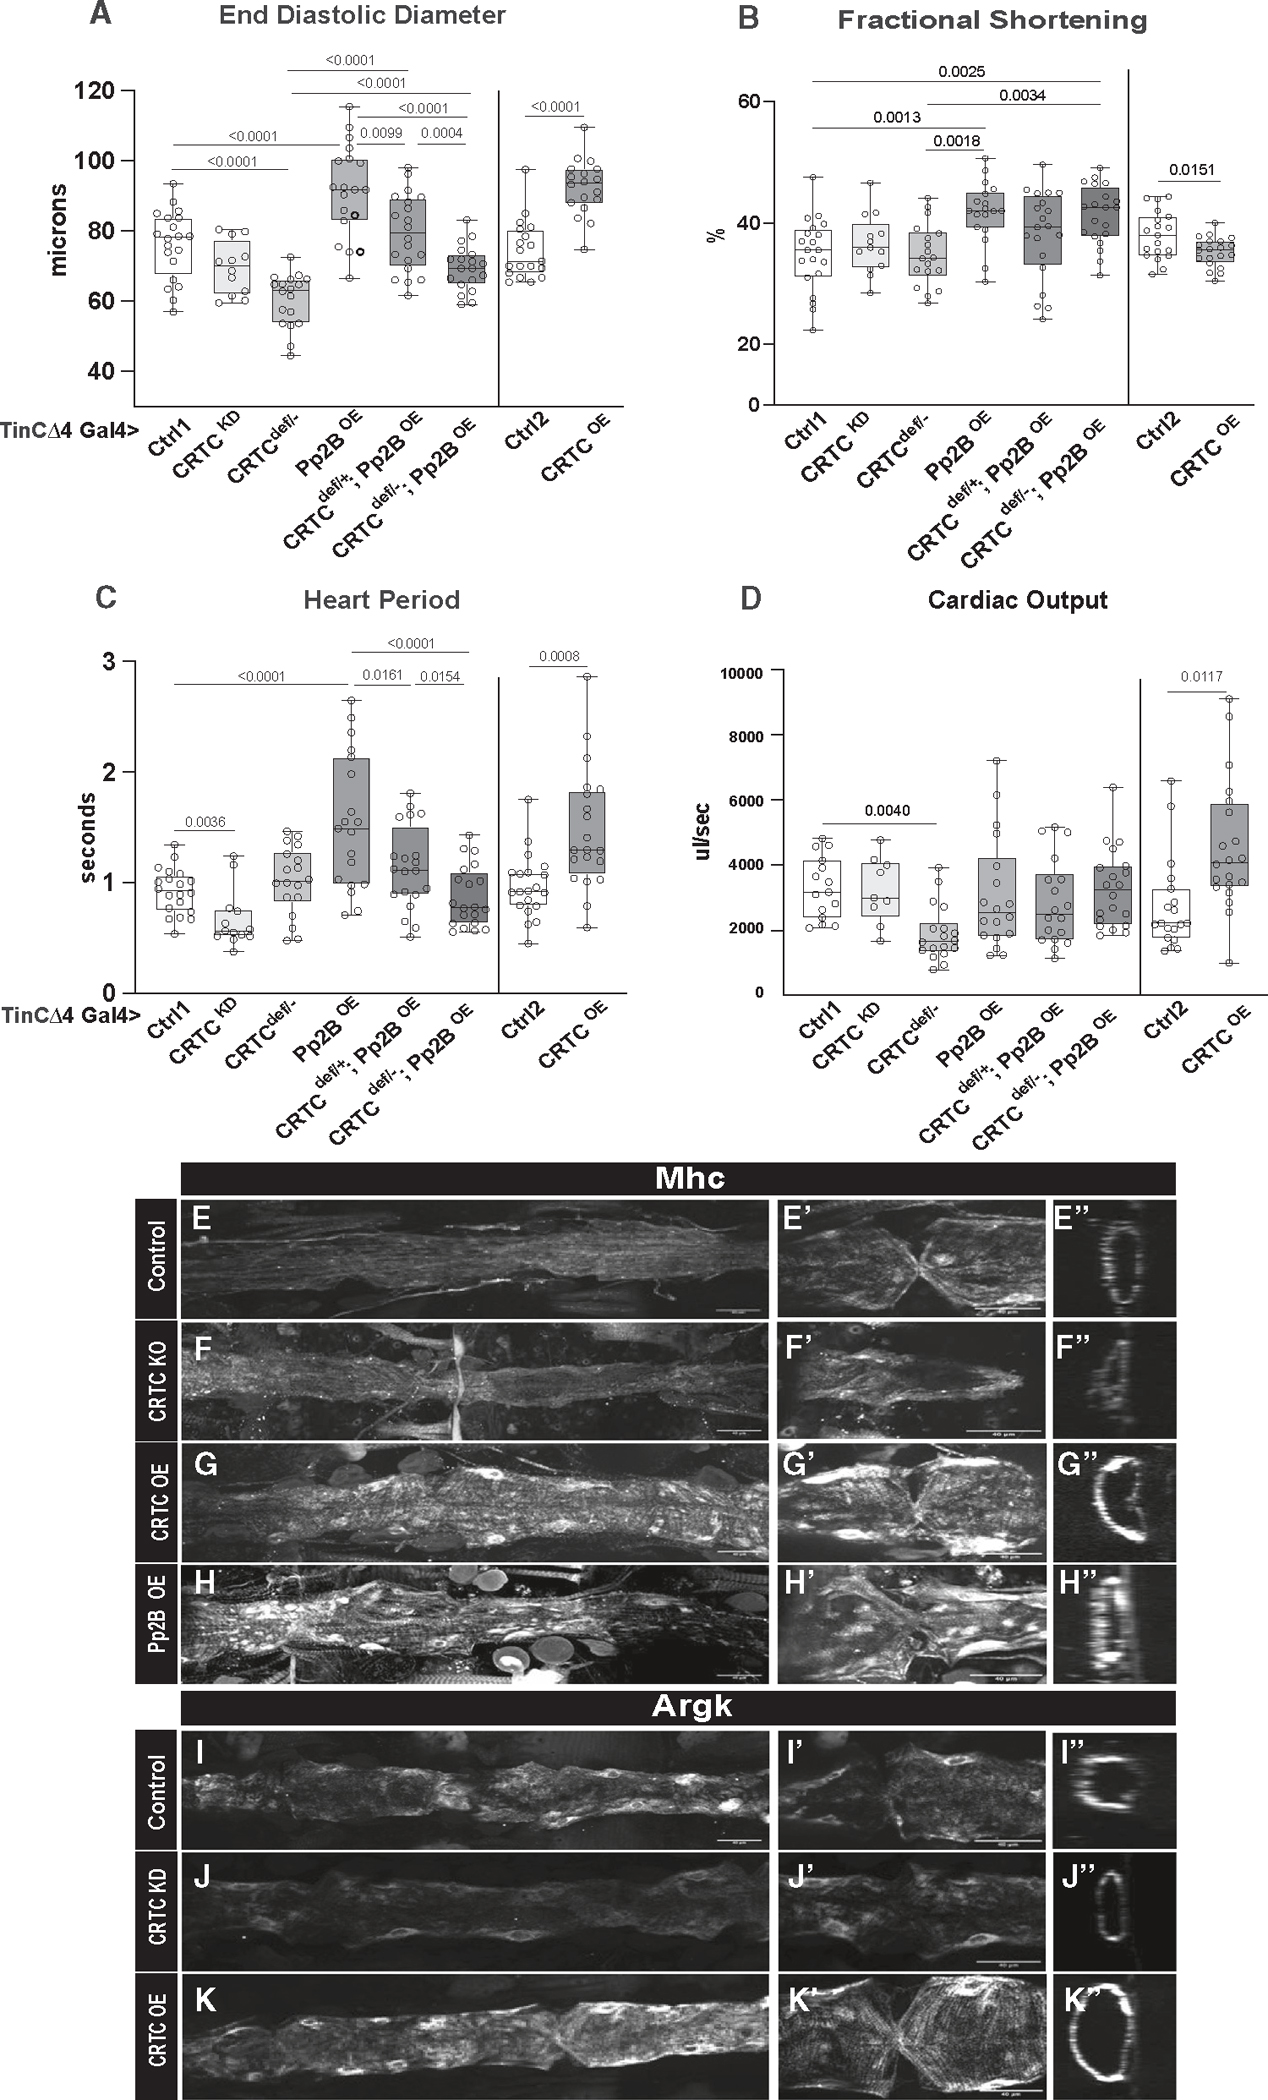
Figure 3. Hypertrophic effects of Calcineurin/Pp2B are rescued by reductions in CRTC.

(A) (Left) EDD was reduced in hearts from cardiac-specific CRTC KD and CRTCdeficiency/− mutants compared to genetic background controls. Constitutive cardiac Pp2B OE increased EDD, which was progressively rescued in CRTCdef/+ (heterozygous) and CRTCdef/− (homozygous) mutant backgrounds. (Right) Cardiac-specific CRTC OE caused a significant increase in EDD, as for cardiac Pp2B OE.
(B) (Left) Fractional shortening increased with cardiac-specific Pp2B OE but was unaffected by reduced CRTC expression. (Right) CRTC OE caused a reduction in fractional shortening compared to genetic background controls.
(C) (Left) Cardiac-specific CRTC KD caused tachycardia (shorter heart periods), whereas Pp2B OE caused bradycardia (longer heart periods) that was progressively reversed by reducing CRTC expression. (Right) CRTC OE caused bradycardia compared to genetic background controls.
(D) (Left) Cardiac output was again reduced in response to cardiac-specific CRTC KD. (Right) Output was increased by cardiac CRTC OE.
(For A–D, plots show all data points, max, min, median, and p values; significance by one-way ANOVA with Tukey’s multiple comparisons post hoc test).
(E–H) HCR was used to examine expression of the hypertrophic marker Mhc (myosin heavy chain) in the fly heart. (E) Mhc expression in the control heart is uniformly distributed along the tube, (E′) in the myocardial cells of a single chamber, and (E″) in an optical cross section of the heart. (F) Mhc expression is slightly reduced in CRTC mutant heart, (F′) in the myocardial cells, and (F″) in an optical cross section. (G) Mhc expression is dramatically increased in the CRTC OE heart, (G′) in the thickened myocardial cells, and (G″) in a myocardial cell cross section. (H) Mhc expression is dramatically increased in the Pp2B OE heart, (H′) in the thickened myocardial cells, and (H″) in a myocardial cell cross section.
(I–K) Arginine kinase (Argk) is the fly ortholog of creatine kinase, a marker for cardiac damage. (I) Argk expression was uniformly distributed in the control heart, (I′) in myocardial cells, and (I″) in the cardiac tube cross section. (J) Argk expression was slightly reduced in the CRTC mutant heart, (J′) in the myocardial cells, and (J″) in the cardiac tube cross section. (K) Argk expression was dramatically increased in the CRTC-OE heart, (K′) in the myocardial cells, and (K″) in the cross section.
(For E–K″, all images were taken with the same exposure settings; scale bars represent 40 μm).
