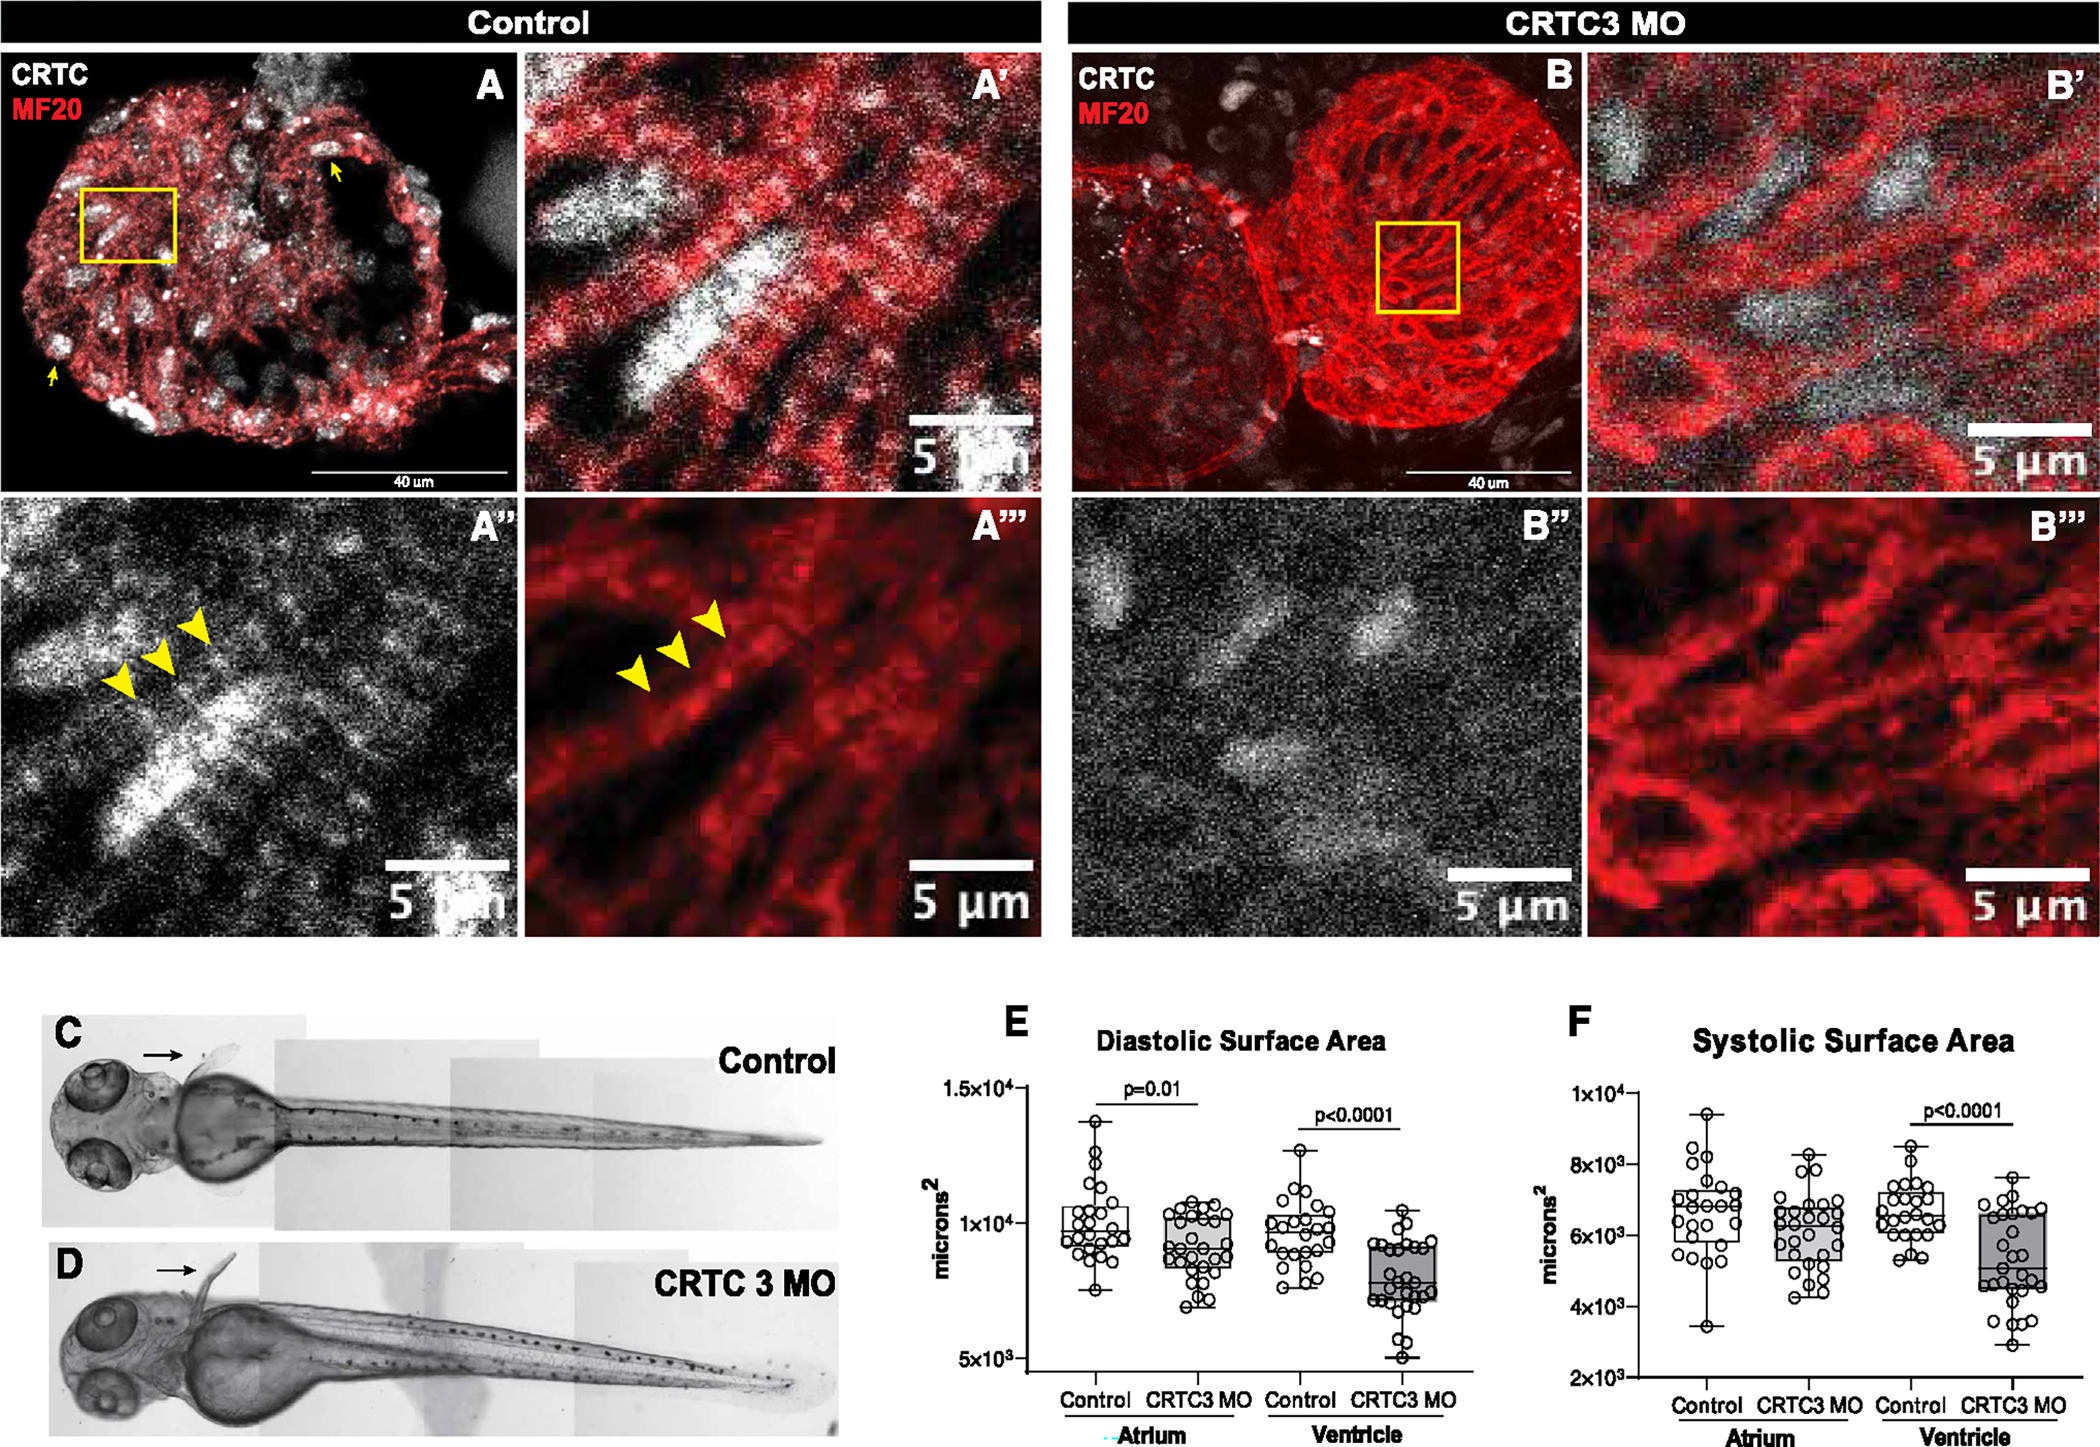
Figure 4. CRTC affects cardiac structure and function in zebrafish.

(A) Hearts from 72 hpf zebrafish were stained for myosin (MF20, red) and CRTC (white). Scale bar, 40 μm. (A′) Magnified inset from (A) showing significant nuclear localization of CRTC. (A″) CRTC also showed a distinct banded structure in cardiomyocytes (arrowheads; scale bar, 5 μm). (A‴) Myosin staining showing cardiac myofibrils. The position of CRTC staining in A″ is shown by arrowheads and appears to localize between bands of myosin staining. Scale bar, 5 μm.
(B) CRTC3 morpholino-KD hearts stained for myosin (MF20, red) and CRTC (white; note that all images in the CRTC channel were significantly overexposed). Scale bar, 40 μm. (B′) Magnified inset from (B) showing some residual CRTC in nuclei. (B″) CRTC staining in the morpholino heart was reduced and diffuse and did not show any structure pattern. Scale bar, 5 μm. (B‴) Myosin staining showing cardiac myofibrils. Scale bar, 5 μm.
(C and D) Images of (C) control (DMSO injected) and (D) CRTC-KD fish at 72 hpf show normal development of body-wall muscle and fins (arrows).
(E) End diastolic surface area of hearts in 72 hpf fish was significantly reduced in atria and especially in the ventricles, following MO KD of CRTC3.
(D) End systolic surface area in ventricles was also significantly reduced. (For D and E, plots show all data points, max, min, median, and p values; significance by two-way unpaired t test).
