
Figure 2.
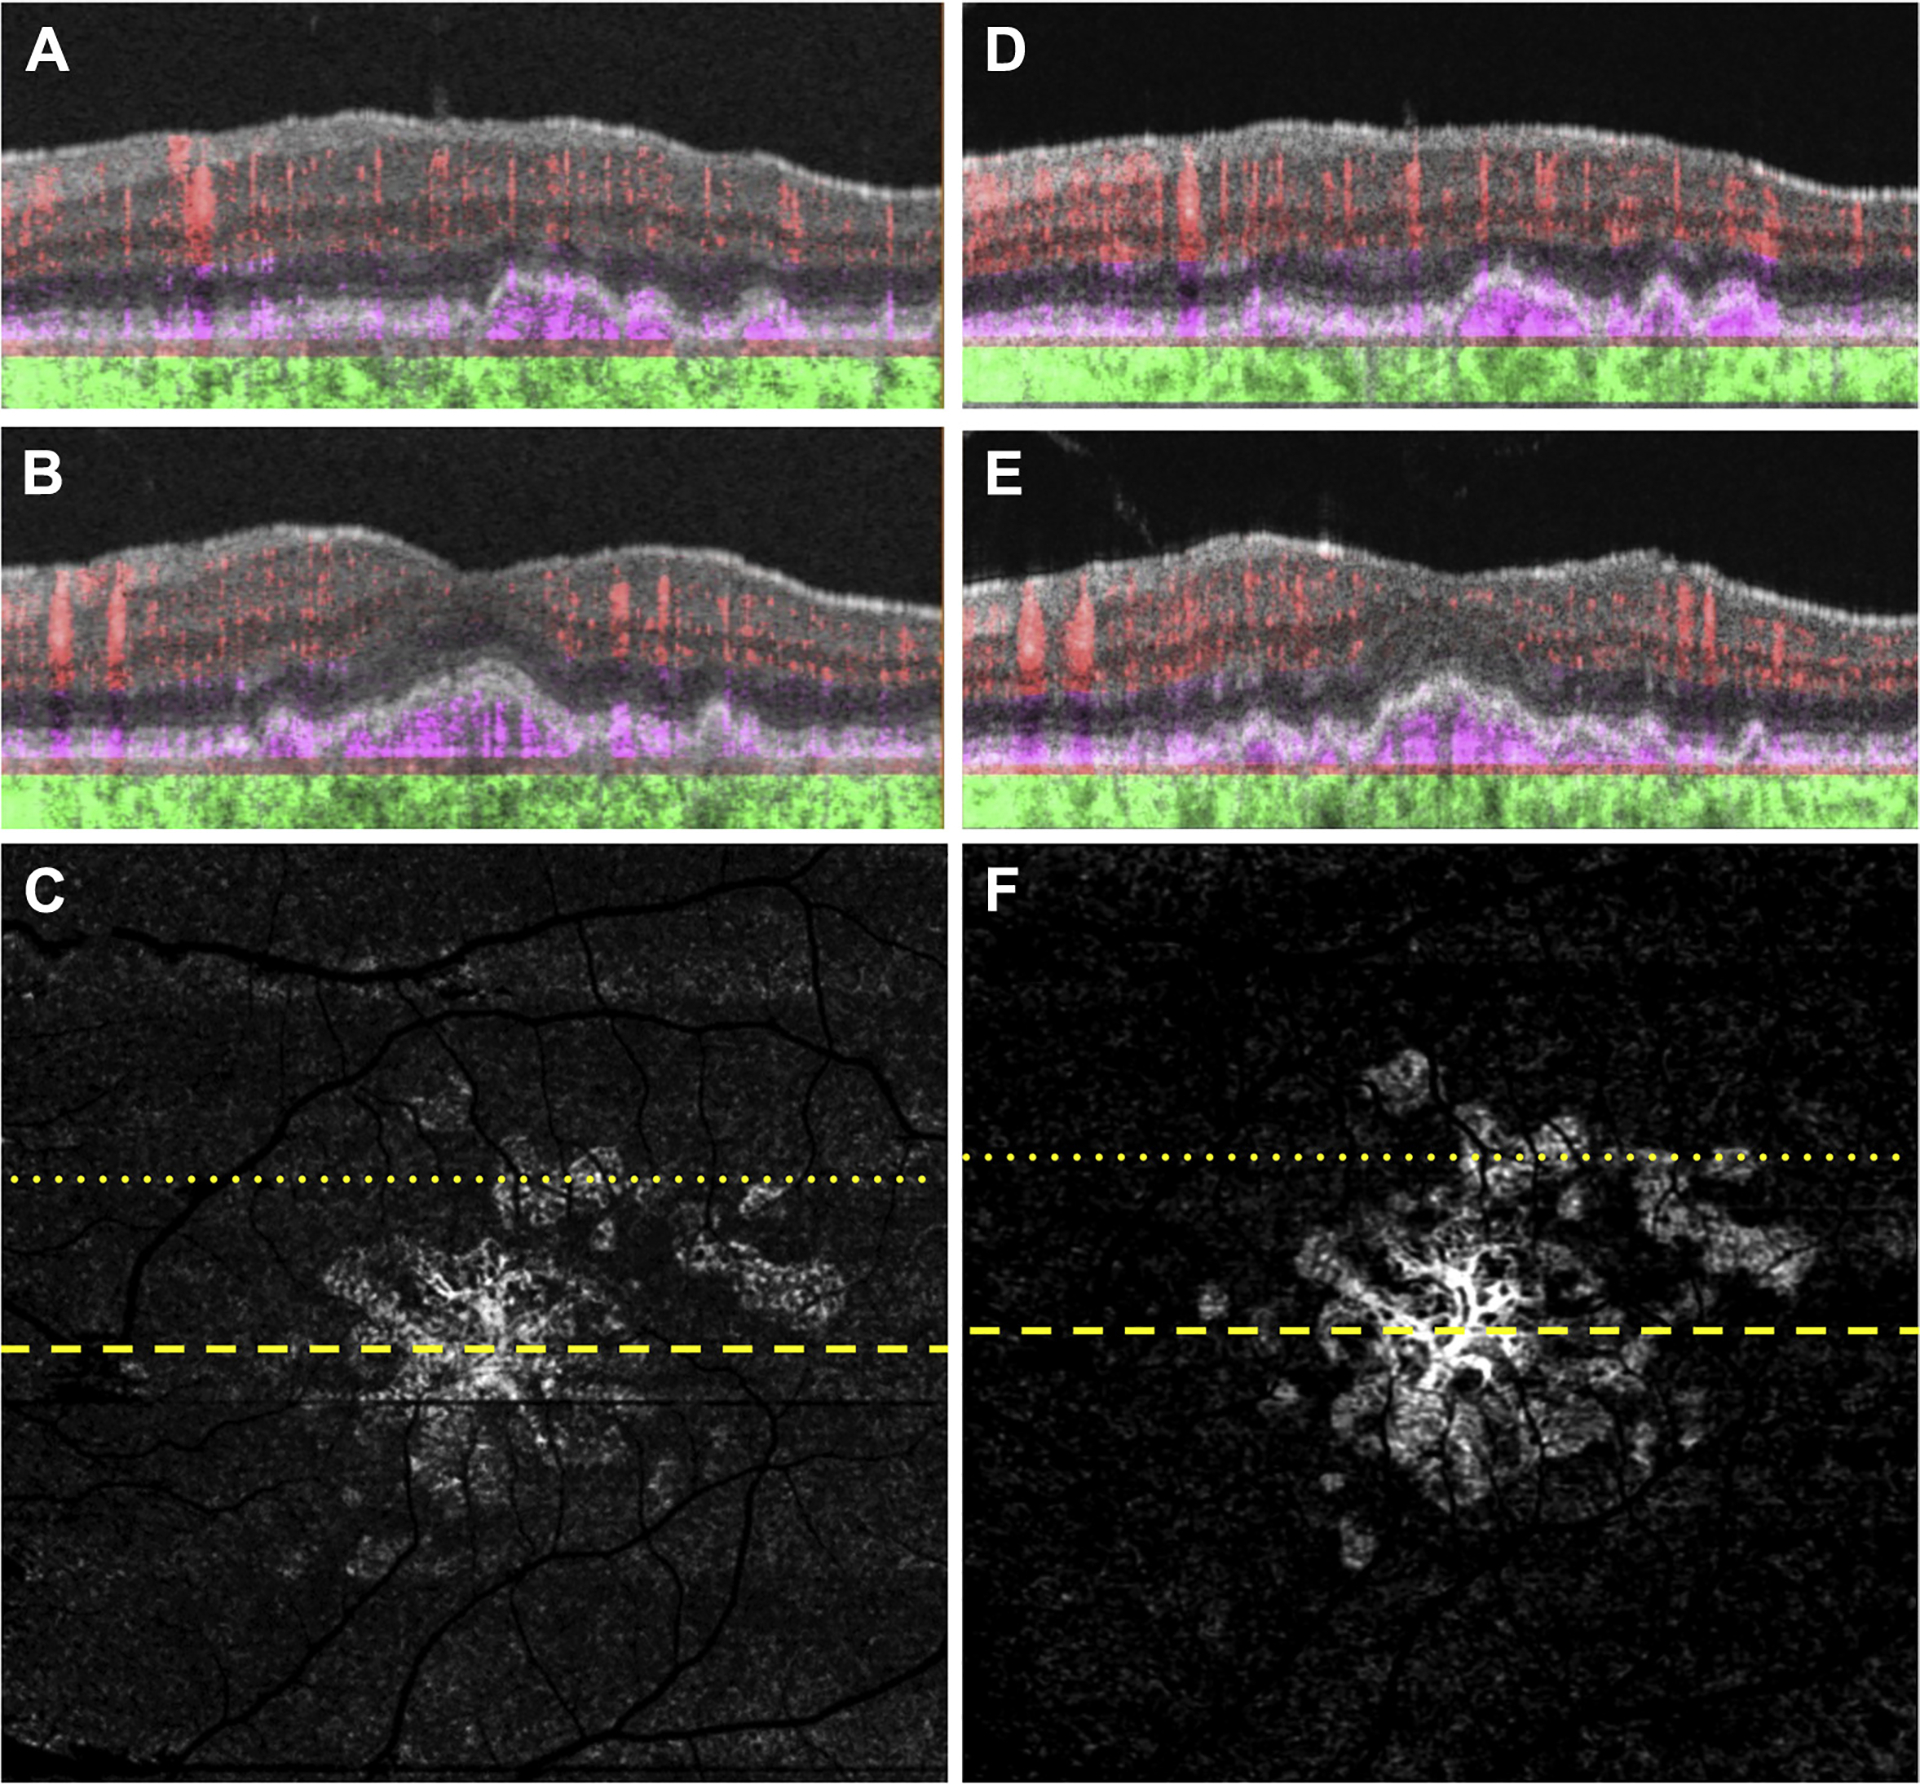
Swept-source (SS) OCT angiography (OCTA) of the same eye as in Figure 1 imaged using a 6×6 mm scan. A, B, Optical coherence tomography B-scan (A) superior to the fovea and (B) through the fovea with color-coded flow represented as red for the retinal microvasculature, pink for the outer retina-to-choriocapillaris (ORCC) slab, and green for the remainder of the choroid. Note the pink coloration under the retinal pigment epithelium and above Bruch’s membrane, which represents the type 1 macular neovascularization. C, Swept-source OCTA en face ORCC slab image with removal of retinal vessel projection artifacts showing macular neovascularization that is multilobular and multifocal with a total area of 4.70 mm2 as determined by using an automated quantification algorithm that was described previously.17 The dotted and dashed lines represent the B-scans contained in (A) and (B), respectively. The 6×6 mm scans could not be performed by the prototype SS OCTA instrument before this visit. D, E, Images obtained 14 months after those in (A–C): OCT B-scans with color-coded flow (D) superior to the fovea and (E) through the fovea. F, Swept-source OCTA en face ORCC slab image with removal of retinal vessel projection artifacts showing a neovascular lesion with an area of 5.11 mm2. The dotted and dashed lines represent the B-scans contained in (D) and (E), respectively.