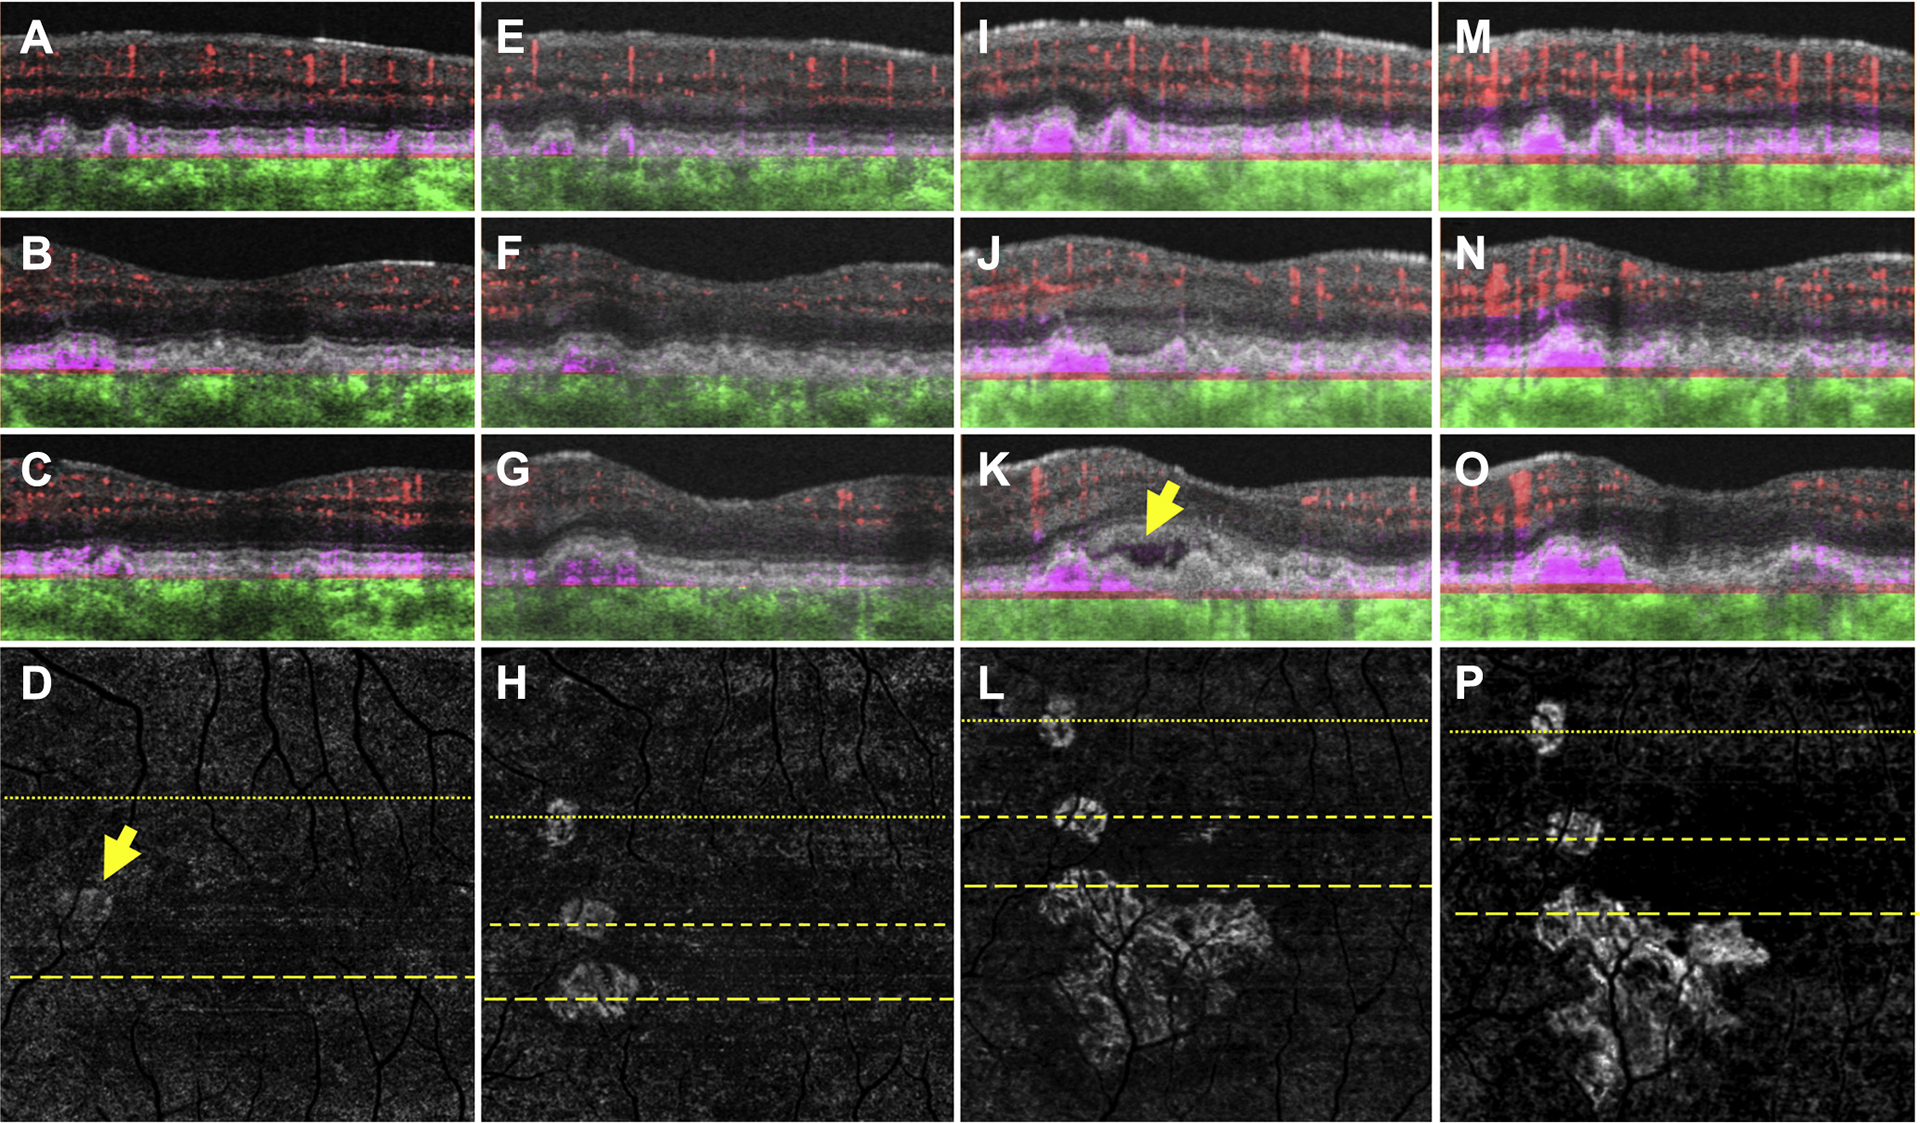
Figure 7.

Swept-source OCT angiography (OCTA; 3×3 mm) of an asymptomatic eye from a patient with nonexudative age-related macular degeneration in which exudation from 1 of 3 neovascular foci developed after 18 months of observation. (A–C) Optical coherence tomography B-scans (A) superior to the fovea and (B, C) through the parafoveal region with color-coded flow represented as red for the retinal microvasculature, pink for the outer retina to choriocapillaris (ORCC) slab, and green for the remainder of the choroid. Note the pink coloration under the retinal pigment epithelium and above Bruch’s membrane, which represents type 1 macular neovascularization (MNV). D, Swept-source OCTA en face ORCC slab image with removal of retinal vessel projection artifacts showing MNV with a total area of 0.08 mm2 (arrow).17 The dotted line represents the B-scan contained (A), and the dashed line represents the B-scan contained in (C). E–H, Images obtained 13 months after those in (A–D). OCT B-scans with color-coded flow (E) superior to the fovea and (F, G) through the parafoveal region. H, Swept-source OCTA en face ORCC slab image with removal of retinal vessel projection artifacts showing the MNV with a total area of 0.30 mm2. The dotted line represents the B-scan contained in (E), and the first and second dashed lines represent the B-scans contained in (F, G), respectively. I–L, Images obtained 5 months after those in (E–H). OCT B-scans with color-coded flow (I) superior to the fovea and (J, K) through the parafoveal region. Only 1 of the neovascular foci appears to be associated with new onset exudation (K, arrow). L, Swept-source OCTA en face ORCC slab image with removal of retinal vessel projection artifacts showing the MNV with a total area of 1.24 mm2. The dotted line represents the B-scan contained in (I), and the first and second dashed lines represent the B-scans contained in (J, K), respectively. M–P, Images obtained 2 months after those in (I–L) after 2 intravitreal injections of anti-vascular endothelial growth factor (VEGF) therapy. OCT B-scans with color-coded flow (M) superior to the fovea and (N, O) through the parafoveal region. The exudation seen previously has resolved. P, Swept-source OCTA en face ORCC slab image with removal of retinal vessel projection artifacts showing the MNV with a total area of 1.21 mm2. The dotted line represents the B-scan contained in (M), and the first and second dashed lines represent the B-scans contained in (N, O), respectively. After anti-VEGF therapy, no significant change in the configuration of the MNV can be appreciated.
