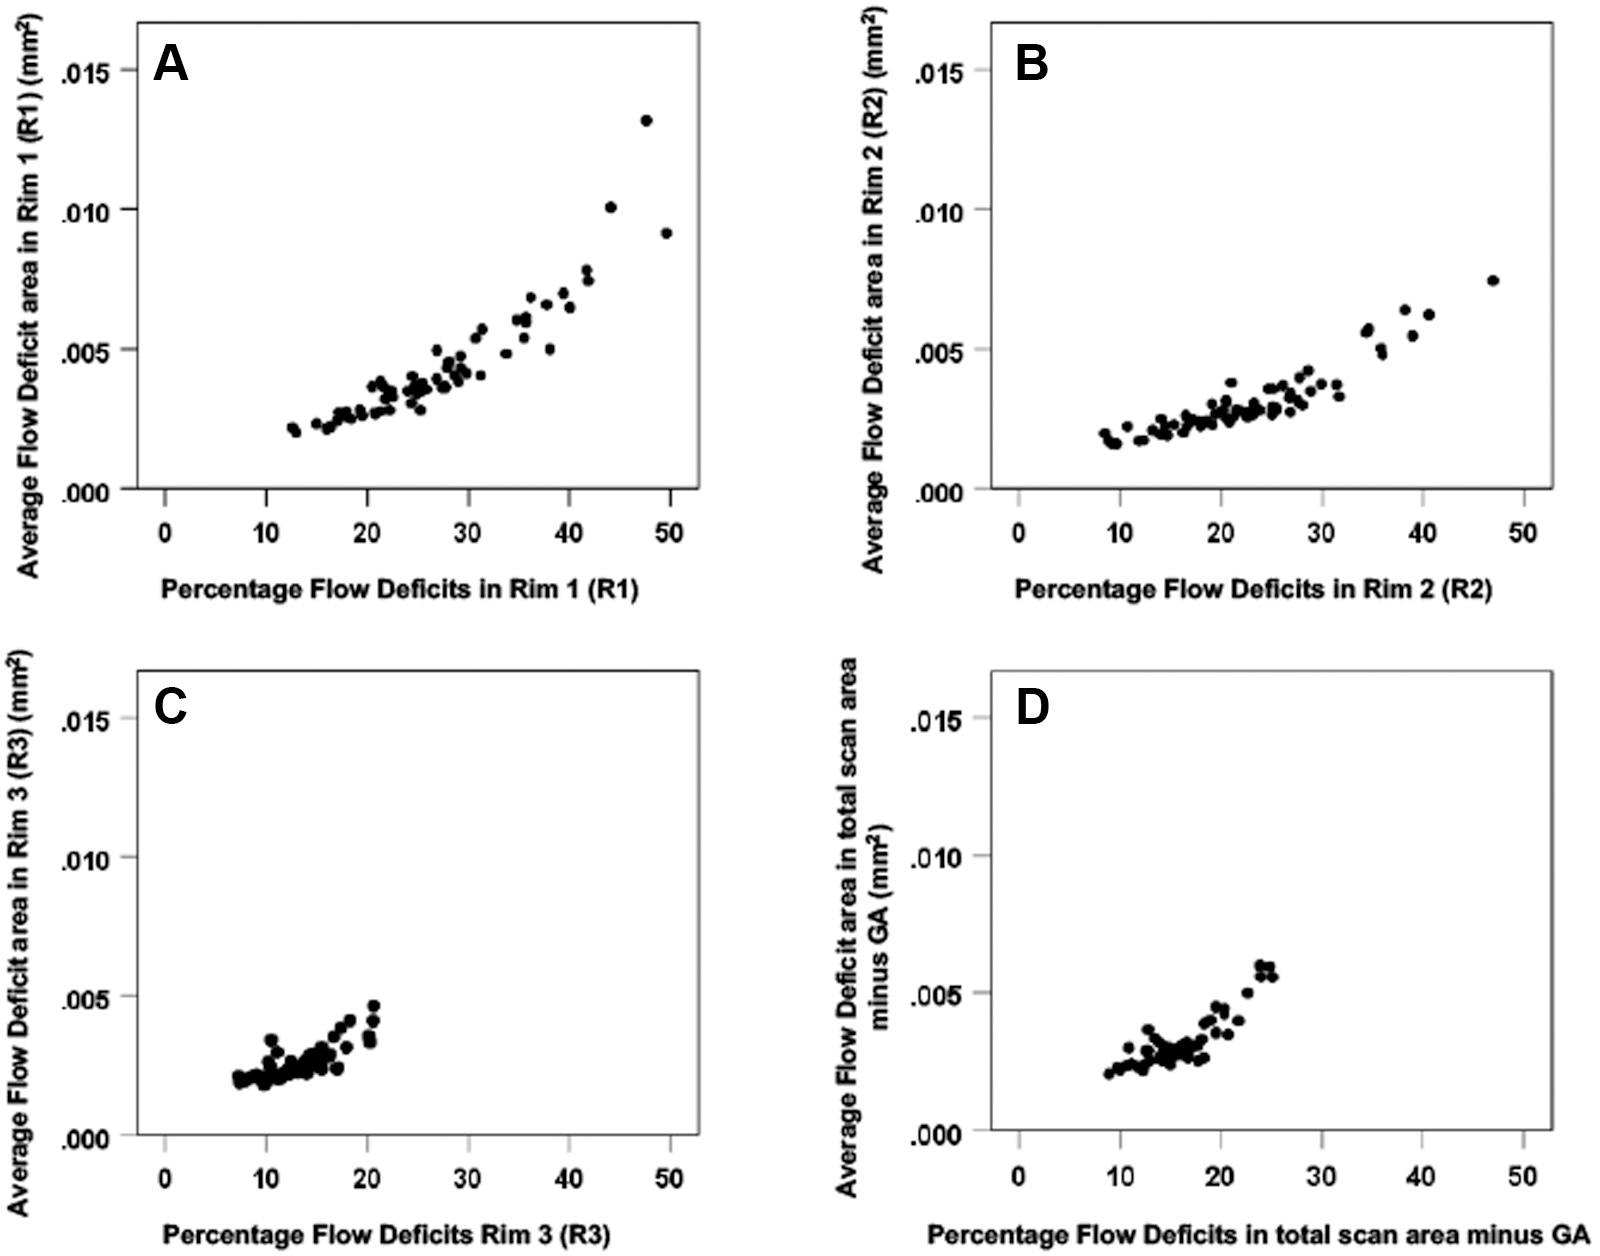
Figure 4.

Scatter plots comparing the choriocapillaris (CC) flow deficit (FD) percentages and the average FD area measurements for the 22 eyes over one year in the different areas around the geographic atrophy (GA): (A) CC FD in Rim1, (B) Rim 2, (C) Rim 3, and (D) Total scan area minus GA. For all pairs of FD parameters, correlations are strong and highly significant presenting a curvilinear relationship (P < 0.001). GA = geographic atrophy.
