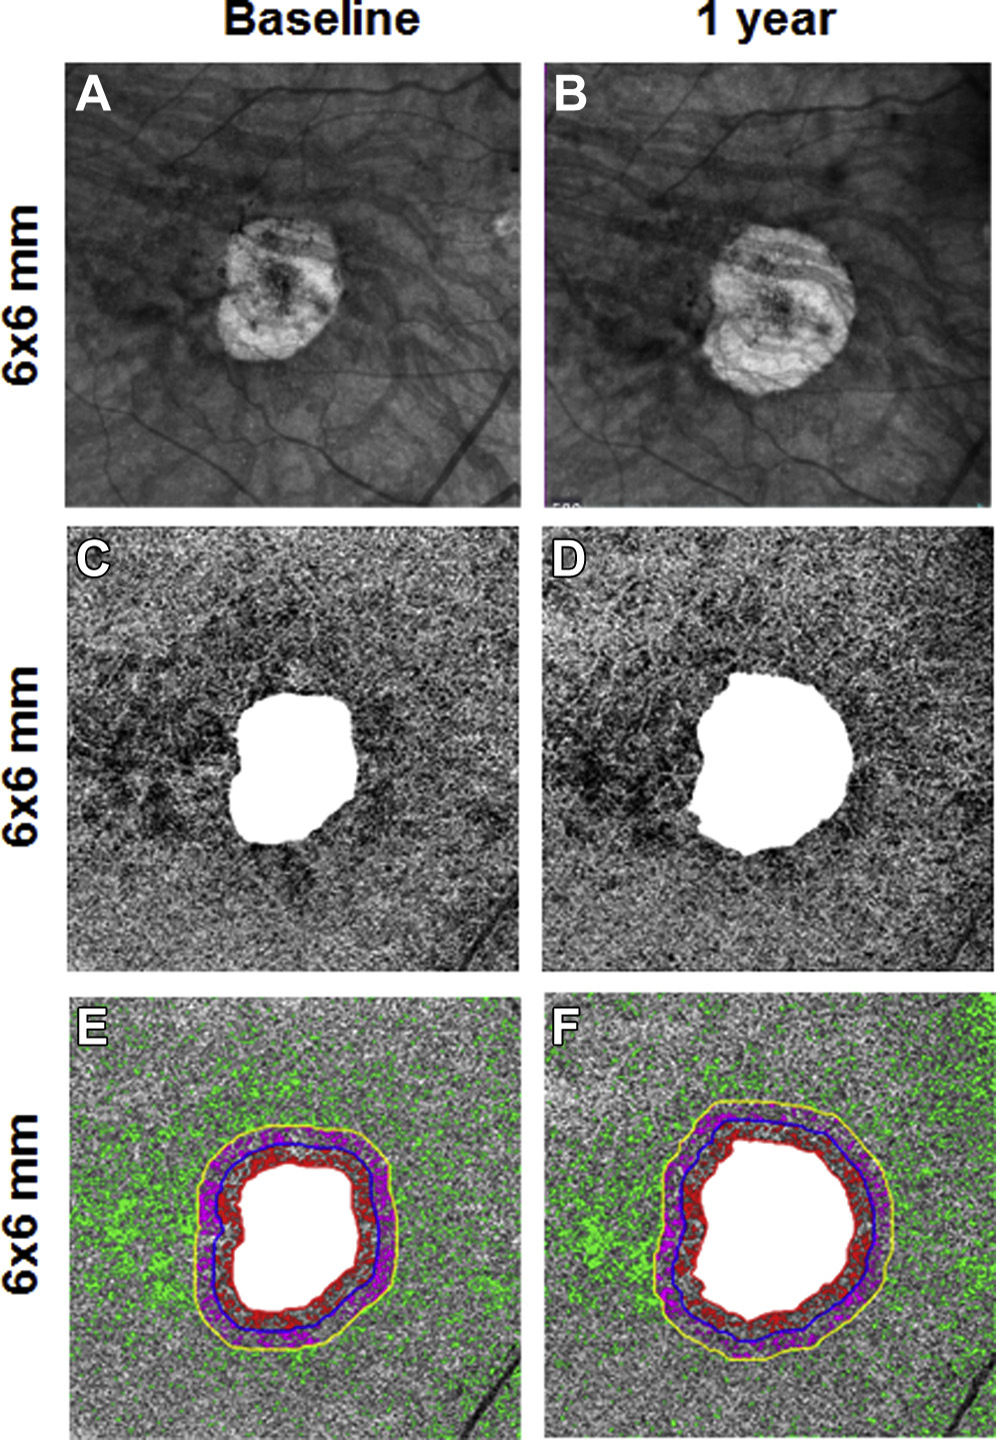
Figure 8.

En face 6×6-mm structure and choriocapillaris (CC) images at baseline and 1 year from the right eye of a patient with geographic atrophy (GA). A, B, Annual enlargement rate (ER) of GA is 0.24 mm/year. C, D, CC en face flow images. E, F, CC flow deficits (FDs) in the different regions: FD% and average2flow deficit area (FDa) at baseline in R1 (FD%: 31.2%; FDa: 0.0040 mm2), R2 (FD%: 28.8%; FDa: 0.0034 mm2), and R3 (FD%: 14.6%; FDa: 0.0025 mm2).
