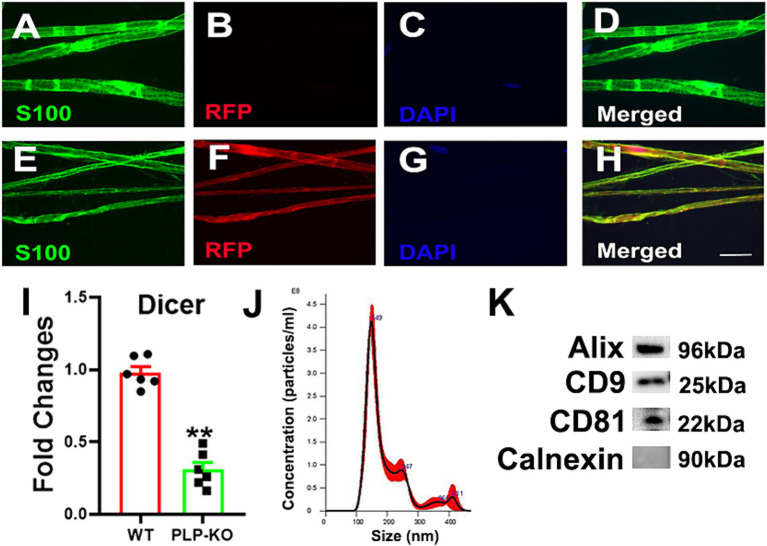
Figure 1.
Characterizations of PLP expressing SC reporter and PLP-cKO mice and SC-Exo. (A–H) Show representative confocal images of teased sciatic nerve fiber from WT (A–D) and PLP-reporter mice (E–H). In WT mice, there was no RFP signal, whereas RFP was co-localized with S100 immunoreactive cells in PLP-reporter mice. Scale bar in H = 20 µm. n = 3/group. (I) Shows that the levels of Dicer mRNA were significantly decreased in the sciatic nerve of PLP-cKO mice compared to WT mice. n = 6/group. Two-tailed Student’s t-test was used for two-group comparisons. **p < 0.01 versus WT mice. Error bars indicate the standard error of the mean. (J,K) Show size and distribution of SC-Exo measured by NanoSight (J) and exosomal marker proteins Alix, CD9 and CD81, and the negative exosomal marker protein Calnexin (K). n = 3/group.

