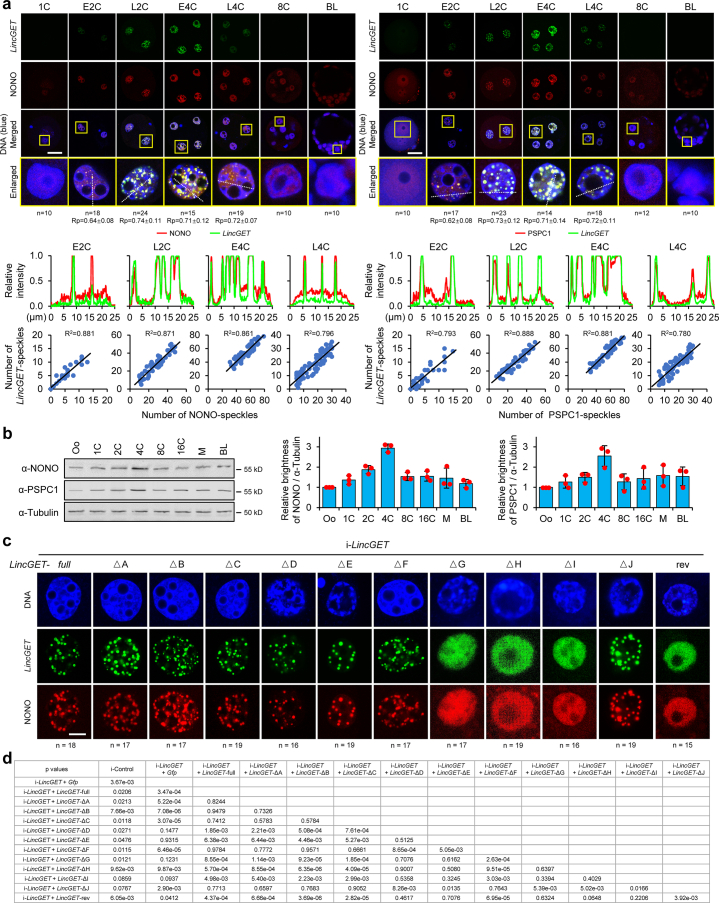
Extended Data Fig. 4. LincGET localizes to paraspeckles.
a. Fluorescence images reflecting the expression pattern of LincGET and NONO (left) or PSPC1 (right) at different stages of mouse preimplantation embryos. Scale bar, 50 μm. Representative nuclei are shown below. The Rp values for co-localization of LincGET and NONO (left) or PSPC1 (right) in early two-cell embryos (E2C), late two-cell embryos (L2C), early four-cell embryos (E4C), and late four-cell embryos (L4C) are calculated by Fiji/ImageJ. Middle panel, line scans of the relative fluorescence intensity of signals indicated by the dotted lines in top panel. Bottom panel, the relationship between the numbers of LincGET-speckles and NONO-speckles (left, 18 × 2 cells of E2C, 24 × 2 cells of L2C, 15 × 4 cells of E4C, and 19 × 4 cells of L4C) or PSPC1-speckles (right, 17 × 2 cells of E2C, 23 × 2 cells of L2C, 14 × 4 cells of E4C, and 18 × 4 cells of L4C) calculated by Imaris is shown in the dot plot, and the R2 (coefficient of determination) values were calculated in Excel. 1C, one-cell embryos; 8C, eight-cell embryos; BL, blastocyst. b. Western blot results showing the expression pattern of NONO and PSPC1 during mouse early embryonic development. Three biological replicates were performed. Tubulin is used as a control. α-, anti. Data are presented as mean values ± SEM (n = 3 biological replicates). kD, kilodalton. c. Single channel of fluorescence images in Fig. 2f showing that LincGET deletion mutants in NONO/PSPC1 binding domain (ΔG, ΔH, or ΔI) cannot form speckles in E4C embryos. The LincGET signals were detected from the large amounts of injected LincGET or mutants. Scale bar, 10 μm. d. The p values for Fig. 2g. One-tailed Student’s t-tests were used for statistical analysis (n = 3 biological replicates).

