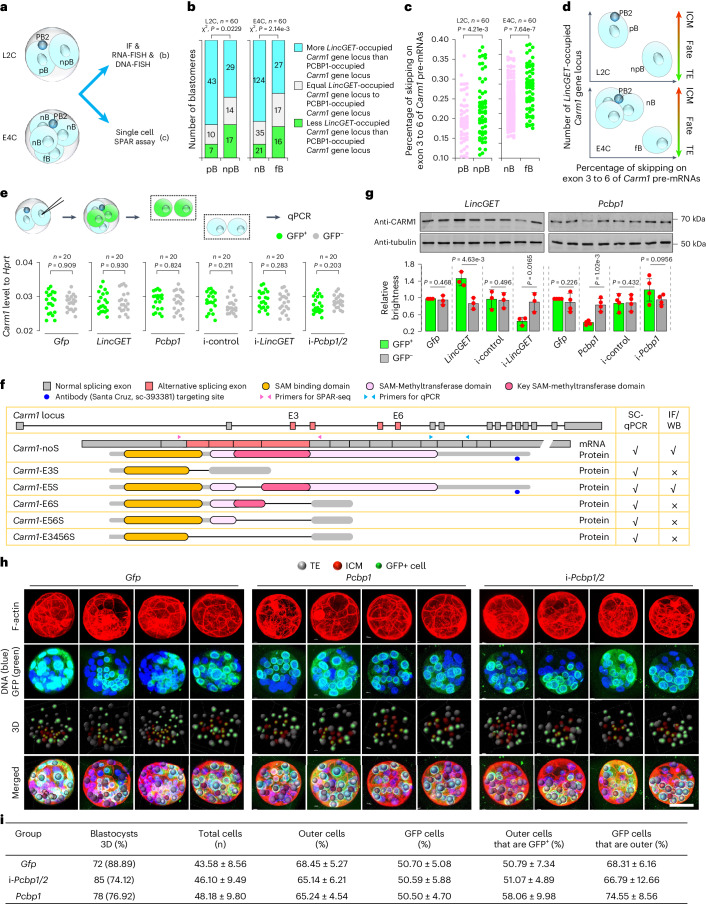
Fig. 5. Alternative splicing contributes to CARM1 heterogeneity.
a–c Illustration of the heterogenous analysis (a) using immunofluorescence combined with RNA-FISH and DNA-FISH (b) and single-cell SPAR assay (c). pB and npB denote the blastomeres attached (pB) or not attached (npB) by the second polar body (PB2) in two-cell embryos; nB and fB denote the blastomeres near (nB) or farthest (fB) from PB2 in tetrahedral four-cell embryos. b, Histogram showing the heterogenous occupancy of LincGET speckles and PCBP1 around the Carm1 gene loci according to the spatial position relative to PB2 in L2C and E4C. χ2 tests are used for statistical analysis with df = 2; n = 60 L2C or E4C examined over four biological replicates. c, Dot plots showing the heterogeneity of ESS of Carm1 pre-mRNAs according to the spatial position relative to PB2 in L2C and E4C. Two-tailed Student’s t-tests are used for statistical analysis. n = 60 L2C or E4C examined over four biological replicates. d, Illustration of the correlation between heterogeneous occupancy of LincGET speckles around the Carm1 gene loci and the heterogeneity of ESS of Carm1 pre-mRNAs. e, Single-cell qPCR assays in E4C. Two-tailed Student’s t-tests were used for statistical analysis. f, ESS events on exons 3 to 6 of Carm1 pre-mRNAs and the corresponding protein structures. Primer sites and antibody-recognizing sites are shown. IF, immunfluorescence; WB, western blot. g, Western blot assays in E4C. Tubulin is used as a control. Data are mean and s.e.m. One-tailed Student’s t-tests were used for statistical analysis (left, n = 3; right, n = 4 biological replicates). h, Examples of three-dimensional (3D) reconstruction analysis. Scale bar, 50 mm. TE, trophectoderm; ICM, inner cell mass. i, Analysis of the distribution of progeny of injected blastomere at the blastocyst stage based on 3D reconstruction. Data are mean ± s.e.m. Two-tailed Student’s t-tests were used for statistical analysis and P values are shown in Extended Data Fig. 10d. Key to table headings are shown in Supplementary Table 8.

