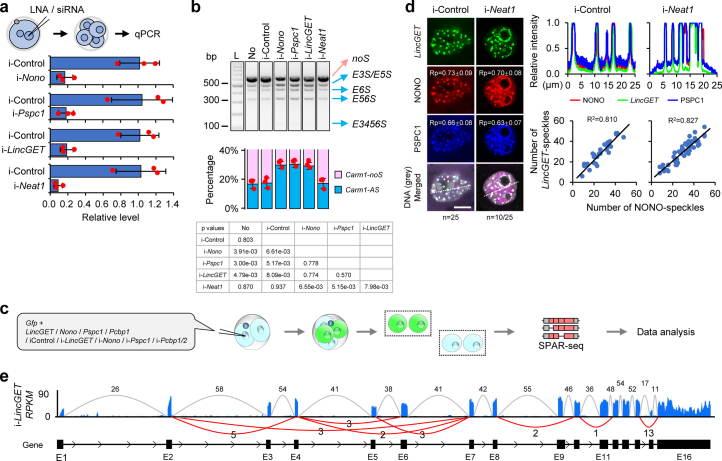
Extended Data Fig. 3. LincGET participates in paraspeckles in mouse two- to four-cell embryos.
a. Interference efficiency analysis of siRNAs on Nono and Pspc1, as well as locked nucleic acid (LNA) on LincGET and Neat1. Data are presented as mean values ± SEM (n = 3 biological replicates). b. Agarose gel analysis of RT-PCR showing changes of ESS of Carm1 pre-mRNAs upon knockdown of Nono, Pspc1, Neat1, or LincGET. The percentages are shown below in combination charts of bar plots and dot plots. Data are presented as mean values ± SEM. One-tailed Student’s t-tests were used for statistical analysis and p values are shown in the table below (n = 3 biological replicates). L, DNA ladder. No, group injected with nothing. c. Illustration of Systematic Parallel Analysis of Endogenous RNA Regulation Coupled to Barcode Sequencing (SPAR-seq). d. Fluorescence images showing Neat1 depletion results in partial re-localization of NONO and PSPC1 from paraspeckles to the periphery of the nucleoli. Scale bar, 10 μm. The Rp values are calculated by Fiji/ImageJ and shown on the pictures. Top right panel, line scans of the relative fluorescence intensity of signals indicated by the dotted line in left panel. Bottom right panel, the relationship between the numbers of LincGET-speckles and NONO-speckles calculated by Imaris (19 × 4 cells of i-Control group and 25 × 4 cells of i-Neat1 group) is shown in the dot plot, and the R2 values were calculated in Excel. e. Sashimi plots visualizing that ESS happens on exons 3 to 6 of Carm1 pre-mRNAs in mouse two-cell embryos upon LincGET depletion. The constitutive splicing events are shown in grey arcs and the alternative splicing events are shown in the red arcs. Note that the control group for LincGET depletion is the sample 2C in Fig. 1a, in which the control LNA is injected.

