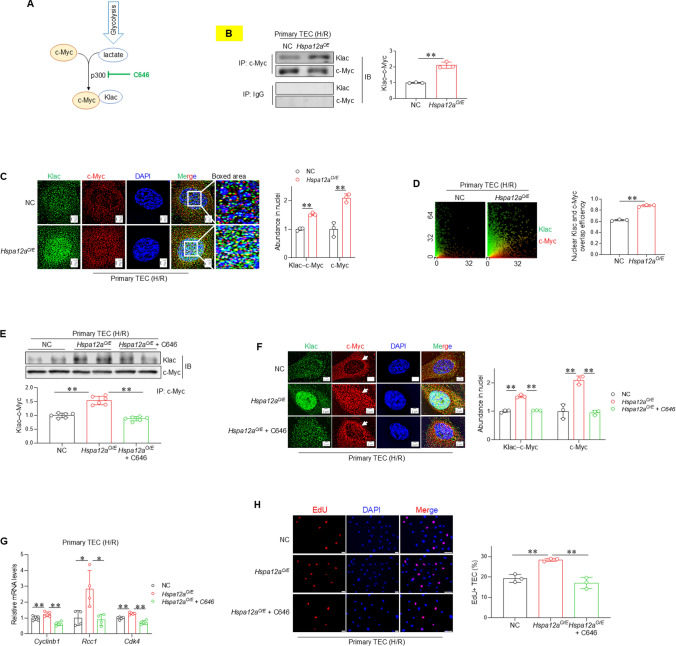
Fig. 5.
c-Myc lactylation mediates the HSPA12A-increased c-Myc nuclear localization in TEC following H/R. A Scheme illustrates the process of c-Myc lactylation. p300 inhibitor C646 was used to inhibit c-Myc lactylation. B c-Myc lactylation. The anti–c-Myc immunoprecipitates were prepared from H/R-treated TEC followed by immunoblotted for L-lactyl-lysine (Klac). The IgG immunoprecipitates served as negative controls. Data are mean ± SD, **P < 0.01 by Student’s two-tailed unpaired t- test. n = 3. C Nuclear localization of lactylated and total c-Myc. Immunostaining for lactylation (Klac, green) and c-Myc (red) was performed in TEC after H/R. DAPI was used to stain nuclei (blue). Data are mean ± SD, **P < 0.01 by Student’s two-tailed unpaired t- test. Scale bar = 2 μm. n = 3. D Overlap efficiency of Klac and c-Myc in nuclei. This overlap efficiency was quantified from the images of (B). Data are mean ± SD, **P < 0.01 by Student’s two-tailed unpaired t- test. n = 3. TEC were challenged with H/R in the presence or absence of C646. The following experiments were performed subsequently. E c-Myc lactylation. Anti–c-Myc immunoprecipitates prepared from H/R-treated TEC were immunoblotted for lactylation antibody (Klac). Data are mean ± SD, **P < 0.01 by one-way ANOVA followed by Brown-Forsythe and Welch test. n = 6. F Nuclear localization of lactylated and total c-Myc. Immunostaining for lactylation (Klac, green) and c-Myc (red) was performed in H/R-treated TEC. DAPI was used to stain nuclei (blue). Data are mean ± SD, ** < 0.01 by one-way ANOVA followed by Tukey’s test. Scale bar = 2 μm. n = 3. Arrows showed reduced nuclear but increased perinuclear localization of c-Myc following inhibition of c-Myc lactylation. G mRNA levels. The mRNA expression of indicated genes were analyzed by RT-PCR. *P < 0.05 and **P < 0. 01 by one-way ANOVA followed by Tukey’s test. n = 4 for Rcc1 groups and n = 5 for all the other groups. H TEC proliferation. Cell proliferation was indicated by EdU incorporation following H/R. Data are mean ± SD, **P < 0.01 by one-way ANOVA followed by Tukey’s test. n = 3. Scale bar = 50 μm

