
Fig. 3. Differential potency and in silico dose-response curve predictions.
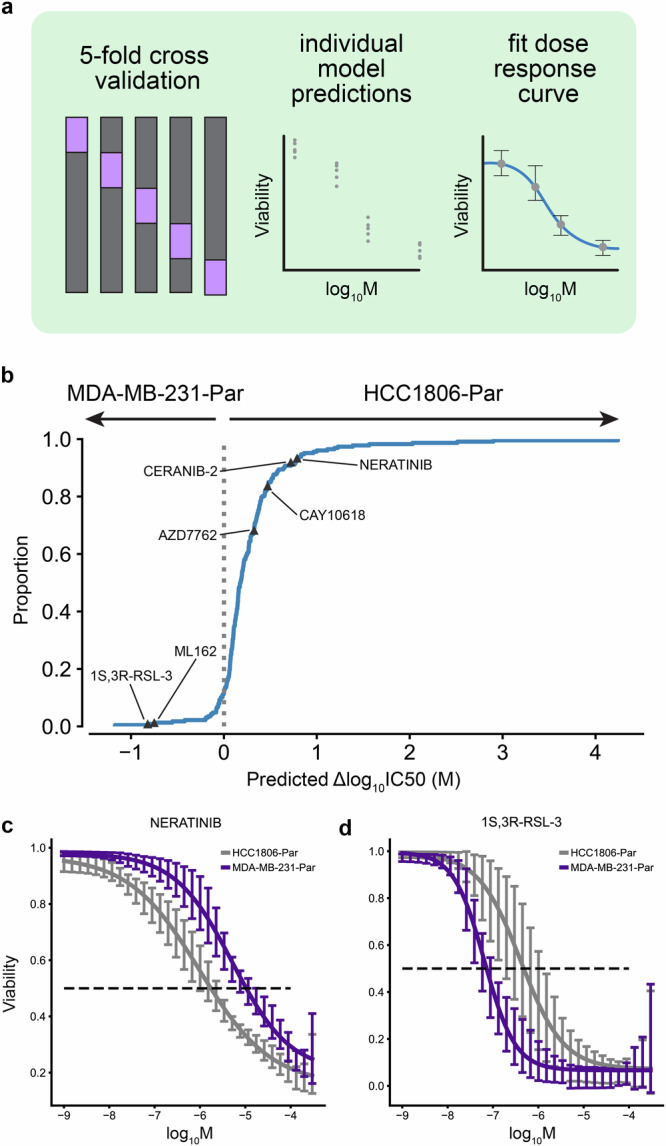
a Approach to model training and dose-response modeling. We trained individual models on held-out cell line dataset splits by 5-fold cross-validation. We then fit log-logistic models to cross-validated model predictions and derived pharmacodynamic features. b Expected cumulative distribution plot of predicted compound IC50 differences between HCC1806-Par and MDA-MB-231-Par cell lines. Compounds selected for in vitro dose-response testing are highlighted. c Predicted dose-response relationships of HCC1806-Par and MDA-MB-231-Par response to neratinib (n = 5 independent samples) and d 1S,3R-RSL-3 (n = 5 independent samples). 95% confidence intervals.