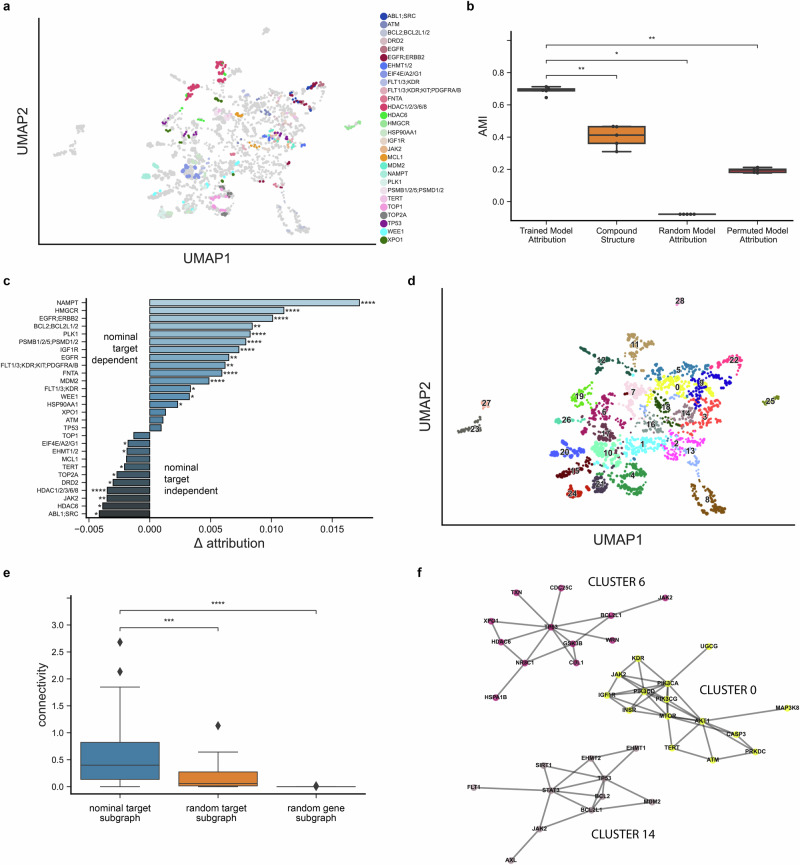
Fig. 5. Feature attribution analysis of nominal compound targets.
a Distinct protein target clusters emerge from UMAP decomposition of adjusted attribution vectors at compound IC50s for predicted and fitted dose-response relationships in MDAMB231, MDAMB231-LM2, HCC1806, HCC1806-LM2b/c, SW480, and SW480-LvM2 prospective cell lines. Control compound set (CCS) attribution vectors colored by nominal target class. b Comparison of adjusted mutual information (AMI) derived from CCS nominal target labels and K-means clustering of trained model adjusted attribution vectors (n = 5 independent samples), compound fingerprints (n = 5 independent samples), random-model adjusted attribution vectors (n = 5 independent samples) and permuted-model adjusted attribution vectors (n = 5 independent samples). Centerline, median; box limits, upper and lower quartiles; whiskers, 1.5x interquartile range; points, outliers; two-sided Wilcoxon rank-sum test; *p < =5e-2, **p < =1e-2. c Average attribution difference between the highest significance target of the nominal target class versus all other target classes. Two-sided Wilcoxon rank-sum test; *p < =5e-2, **p < =1e-2, ***p < =1e-3, ****p < =1e-4. Sample sizes: n = 14 independent case samples, n = 455 independent control samples except otherwise noted; EGFR;ERBB2 (n = 21 case, n = 448 control); HDAC1/2/3/6/8 (n = 56 case, n = 413 control); HMGCR (n = 21 case, n = 448 control); NAMPT (n = 28 case, n = 441 control); TP53 (n = 21 case, n = 448 control). d Leiden clustering of all attribution vectors. e Comparison of PPI subgraph connectivity derived from clustered target profiles (n = 26 independent samples), random target profiles (n = 26 independent samples), and random protein-coding genes (n = 26 independent samples). Centerline, median; box limits, upper and lower quartiles; whiskers, 1.5x interquartile range; points, outliers; two-sided Wilcoxon rank-sum test; ***p < =1e-3, ****p < =1e-4. f Network representation of exemplar clustered target profile subgraphs.

