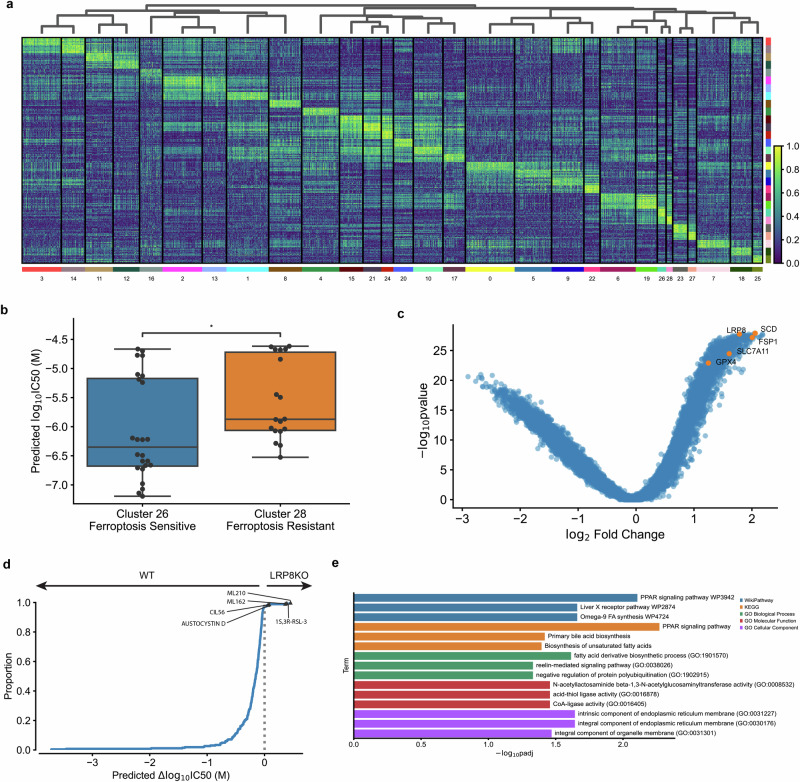
Fig. 6. Differential attribution analysis (DAA) of ferroptosis-inducing compounds.
a Heatmap of top-10 differentially attributed genes within Leiden clusters from Fig. 5d. Clusters ordered by hierarchical clustering of DAA profiles (columns). Rows: top-10 attributed genes, columns: cell line-compound attribution sample. b Comparison of predicted IC50s between cluster 26 (ferroptosis-sensitive, n = 24 independent samples) and cluster 28 (ferroptosis-resistant, n = 18 independent samples). Centerline, median; box limits, upper and lower quartiles; whiskers, 1.5x interquartile range; points, outliers; two-sided Wilcoxon rank-sum test; *p < =5e-2. c Volcano plot of DAA results derived by comparing ferroptosis-inducing compound attributions to all other compound attributions. Known ferroptosis-mediating genes in orange. d Expected cumulative distribution plot of predicted compound IC50 differences between HCC1143 WT and LRP8 KO cell lines. Ferroptosis-inducing compounds predicted differentially potent in LRP8 KO marked. e Enrichment analysis of top-10 differentially attributed genes of ferroptosis-inducing compound samples. Fisher’s exact test.

