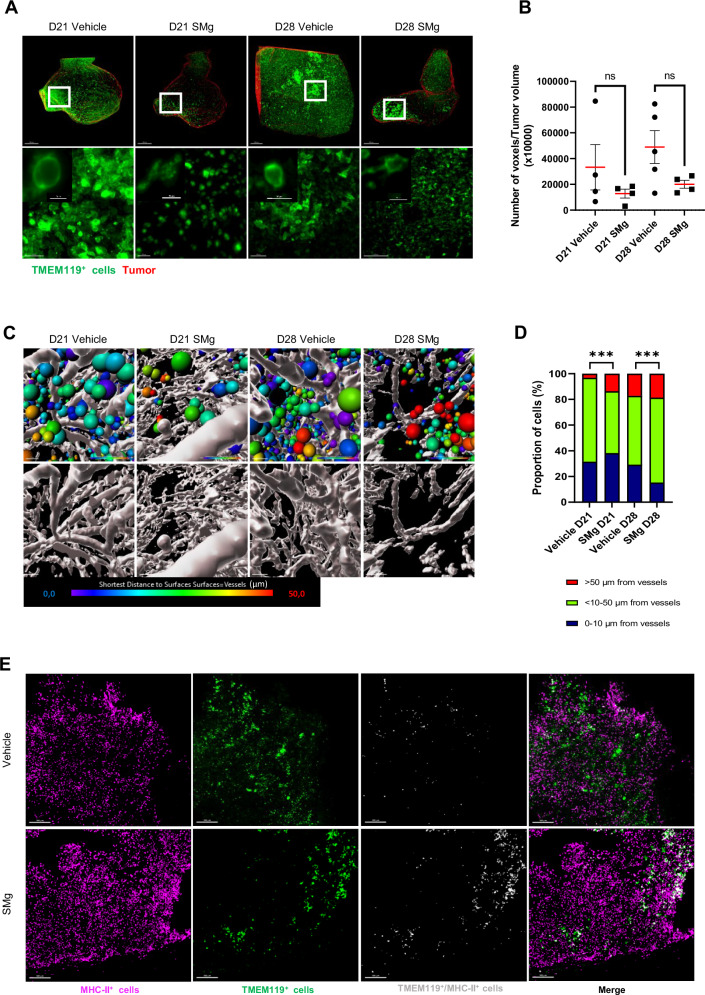
Fig. 6. SMg decreases basal TAM-MG density, promote their infiltration and their activation.
A Representative 3D reconstitution of GL261-DsRed tumors at D21 and D28 in vehicle and SMg-treated mice. Basal TAM-MG were labelled with an anti-TMEM119 antibody (green), and tumors are represented in red (scale bar = 500 µm). White squares identify zoomed areas shown in lower panels. These are Maximum Intensity Projection (MIP) of 1000 µm (scale bar = 100 µm). B Quantification of TMEM119+ cell densities in vehicle and SMg-treated tumors at D21 (n = 4) and D28 (n = 4). Bar graphs represent mean ± s.e.m. Statistical analyses were performed by using Mann-Whitney test; alpha = 0.05. C Heat map representing the distance of TMEM119+ cells from vessels. Each TMEM119+ cell (green) is represented by one spot statistically coded by the shortest distance from vessels (heat map: from 0 µm to vessels in blue to >50 µm in red). Representative images are shown. D Quantification of distance from vessels for each TMEM119+ cell. TMEM119+ cells were separated into 3 categories according to their distance from vessels (1 = 0–10 µm, 2 ≥ 10–50 µm, 3 ≥ 50) at D21 (vehicle n = 249602, SMg n = 175,272) and D28 (vehicle n = 764,564, GDC-0152 n = 157,996). Data are expressed as % of the total number of TMEM119+ cells. Statistical analyses were performed by using the Khi² test; alpha=0.05, bilateral p-value: ***p < 0.0005). E Confocal images of TMEM119 and MHC-II co-stainings of D28 tumors (scale bar = 300 µm). Representative images obtained from 2 tumors per condition are shown. A, C Acquisitions were performed by using 4× optical objective and 2.5× numeric zoom.

